


Optimizing Phosphorus Fertilizer Use: Evidence from Michigan Corn Production
This article explores the relationship reported by farmers between commercially applied phosphorus (P), accumulated P in the soil, and the yield of corn. Understanding what farmers are experiencing is important for effective communication of findings from academic research and for helping farmers optimize the use of P. Both farmer-reported relationships and model generated results in this study suggest many farmers can improve farm profitability and environmental performance by applying P only when soil test levels indicate to do so.
Overview
P plays a critical role in corn production, supporting root development, growth, and overall plant health. However, with repeated applications over time, P can accumulate in the soil, reducing the need for added P. This dynamic interaction is highlighted in numerous studies (for example, Dodd and Mallarino 2005, Anthony et al. 2013, Drescher et al. 2021, Sarkar et al. 2024, Sarkar et al. 2025), and is particularly relevant in the Midwest, where soil P has steadily increased. Reflecting the findings of these numerous studies, a common extension recommendation is:
- If soil P is 0–20 ppm, supplemental P is critical for healthy crop growth.
- If soil P exceeds 40 ppm, no added P is needed.
This recommendation implies the need for regular soil testing to effectively manage P.
Data and Approach
The study discussed in this article uses data from a 2018 survey of Michigan corn producers. Response rate was 30% with 1,650 usable surveys. Respondents provided detailed information about yield and physical characteristics for their largest corn field in 2017, including location, slope, soil types, soil depth, and management practices, as well as details of all nitrogen and P applications, including timing, method of application, and formulation. Google Maps was used to obtain geographically specific locations for the corn fields.
Average size of the corn fields in the survey was 83 acres. Average yield in 2017 for these fields was 174 bushels per acre. 89% of the fields were in Michigan’s Lower Peninsula across 64 counties. Only 2% of respondents used conventional tillage, 25% used no till, and the rest used minimum tillage. 55% of respondents reported not receiving any information on yield response to P over the prior five years, and 19% expressed interest in improving nutrient practices. For additional discussion of the survey design, data, and findings; see Sarkar et al. (2024a, 2025).
Average P Applied
Application of commercial P varied considerably (see Figure 1). 24% of the farmer respondents applied no commercial P or P via manure. 20% applied more than 60 pounds of commercial P. In total, 59% (979 farmers) applied commercial P fertilizer on their largest corn field in 2017, 21% applied manure, and 9% applied both. An important consideration in assessing the survey responses is that farmers may apply P in a year for use by crops planted over multiple years. For example, a farmer may apply P only once every other year. Another important consideration is that farmers may apply P to insure against uncertain weather conditions rather than trying to increase yield. These behaviors were not covered by the survey questionnaire.

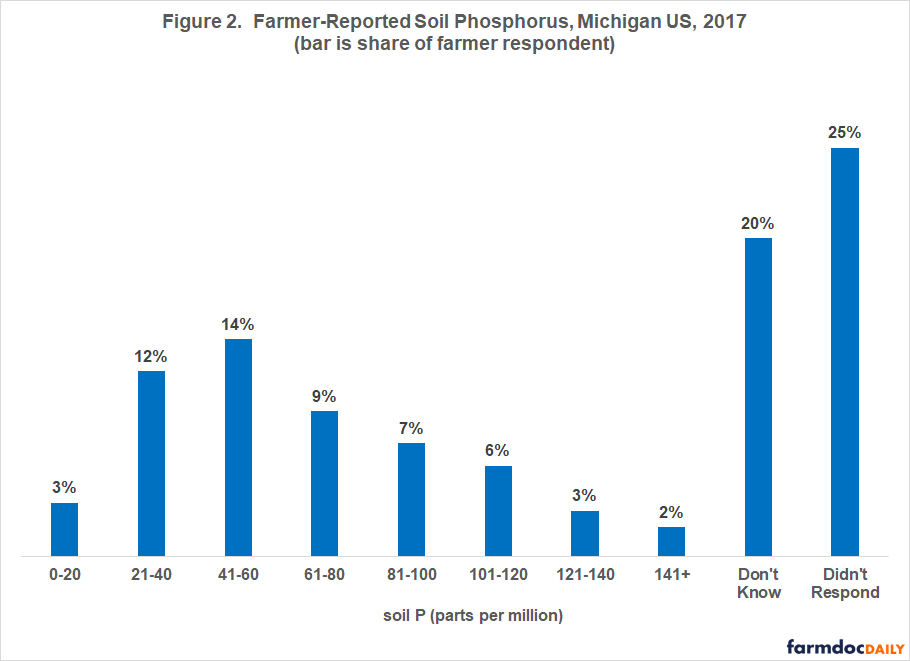
Soil P
Figure 2 shows the distribution of soil P levels reported by farmers using one of eight categories provided on the survey. Soil P is measured in ppm (parts per million). 20% of respondents (327 farmers) reported not knowing their soil P. This indicates an information gap. Of the 903 fields for which farmers reported a soil P, 73% had a soil P above 40 ppm, a level that extension recommendations conventionally identify as requiring no added P (for example, Culman et al. 2020, Warncke et al. 2009). Few fields had extreme soil P levels; only 3% had a soil P of 0-20 ppm while only 2% had a soil P above 140 ppm.
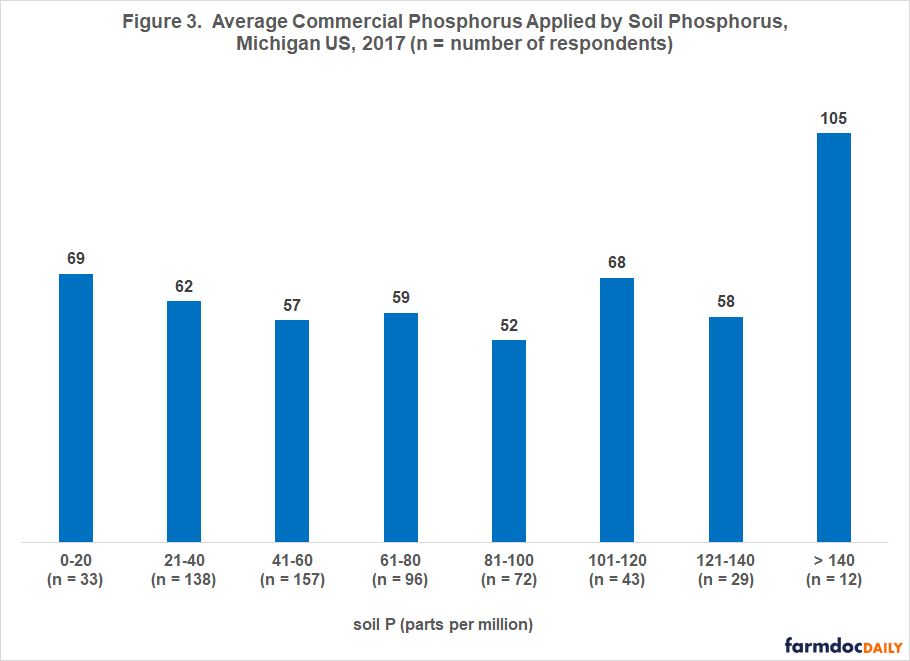
Commercially Applied P by Soil P
Figure 3 shows the average commercial P applied per acre by soil P for the 580 farmer respondents who reported both soil P and applying commercial P. Except for fields with a soil P of more than 140 ppm, average commercial P applied varied little by soil P. The small number of fields with a soil P greater than 140 suggests caution in interpreting the data in this soil P category. However, it is reasonable that, given the research on the interrelationship between soil P and applied P, the fields with the highest soil P would have the highest amount of commercial P applied.
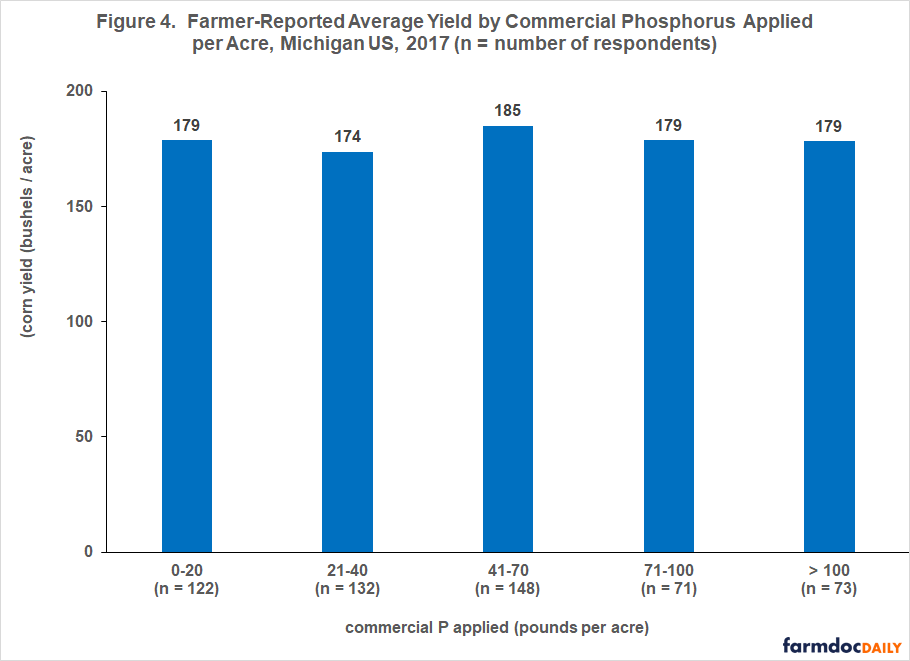
Farmer-Reported Relationship between Yield and Commercially Applied P
Figure 4 reports the relationship that farmer respondents as a group reported between commercially applied P and corn yield on their largest corn field in 2017. Average corn yield varied little across the P application categories. Thus, when examined as a group, farmer-reported experiences did not reveal that increased application of P was associated with higher average yields.
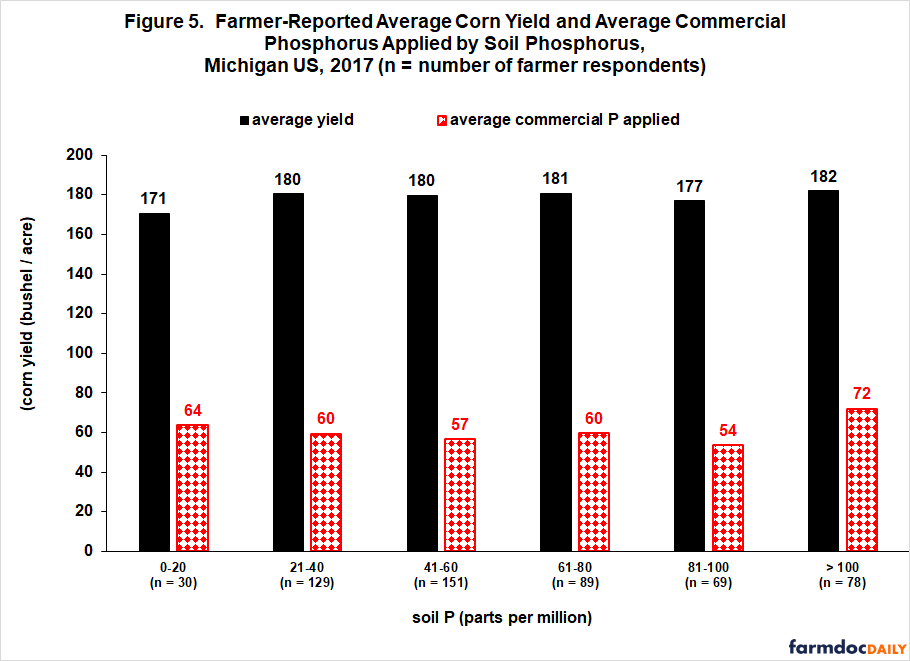
Farmer-Reported Relationship between Yield, Soil P, and Commercially Applied P
Figure 5 presents the farmer-reported relationship between corn yield and pounds of commercial P applied by soil P category. Yield was lowest for fields with the lowest soil P, suggesting that applying more commercial P may be an economically effective management strategy for these fields. For the categories with soil P greater than 20 ppm, average yields were similar. Average yield for fields with the highest soil P was only one to two bushels higher than fields with soil P between 21 and 80. Average commercial P applied showed no trend by soil P except for the previously noted higher application for the fields with the highest soil P. For the fields with the highest soil P, the small increase in their average yield relative to the other fields clearly raises the question of whether the increase in yield was economically effective.
Agronomic Model Relationship between Yield, Soil P, and Commercially Applied P
The relationships in Figures 4 and 5 are described as unconditional because many other factors affect yield, including weather, soil type, topography, tillage practice, and seed variety. Agronomic researchers have thus constructed multi-factor models to estimate yield response to soil P and applied P given constant values for the other factors that affect yield. The simulation model we use is SALUS (System Approach to Land Use Sustainability). For an overview of SALUS, see the Data Note.
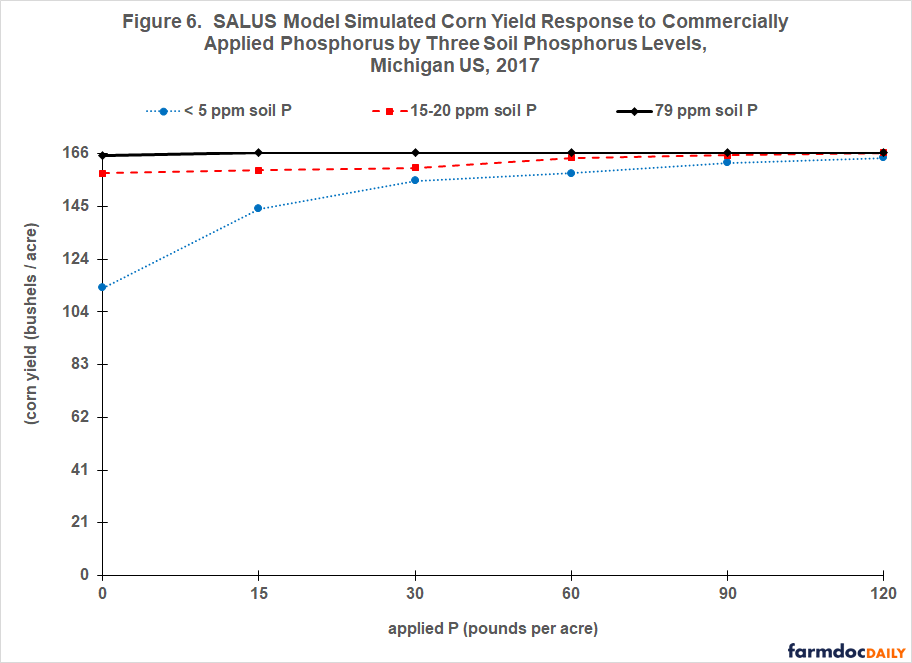
Each field in the survey was examined using SALUS and the field characteristics provided by the farmer respondent. Given its characteristics, 54 scenarios were run for each field involving different combinations of soil P, commercial P, and weather conditions. Only these three factors changed; all other field characteristics stayed at the farmer-reported value for the field.
Figure 6 presents the results reported for three soil P levels: 0–5 ppm, 15-20 ppm, and 79 ppm (the average for all farmer respondents). Commercial P application rates examined were 0, 15, 30, 60, 90, and 120 pounds per acre. Corn yield is lowest (113 bushels / acre) when no P is applied and soil P is 0-5 ppm. For fields with soil P of 0-5 ppm, yield increased as more commercial P was applied, but the rate of increase slowed. For fields with soil P of 20–40 ppm, corn yields increased but only from 158 to 166 as commercial P increased from 0 to 120 pounds per acre. Yield did not increase for fields with soil P of 79 ppm.
Discussion
Both farmer-reported relationships and model simulation results suggest notable scope exists for improving P management in general and especially for fields with high soil P levels.
Higher return to corn production should result, an outcome particularly relevant with low current market returns.
Improving corn profit by careful assessment of applied P should also simultaneously improve environmental performance of corn farming.
Research always generates new ideas and reveals new topics to explore. In regard to this research, a useful addition would be to elicit farmer’s reasons for applying the level of P they reported. This is an important topic for future research because it would allow for more informed communications and discussions with farmers that could improve profitability and environmental performance.
Data Note
SALUS is a crop simulation model designed to evaluate the long-term impact of land management decisions on land productivity and environmental performance. SALUS simulates crop growth, yield, soil water balance, nutrient cycling, and carbon dynamics under diverse climate, soil, and management conditions. It has been validated by a number of studies across a range of geographies and cropping systems (Basso et al. (2011), (2014), Giola et al. (2012), Senthikumar et al. (2009), Syswerda et al. (2012)). For a more detailed discussion of SALUS and its use in this analysis, see Sarkar, et al. 2024a.
References
Anthony, P. M., G. L. Malzer, S. D. Sparrow, and M. Zhang. "Corn and Soybean Grain Phosphorus Content Relationship with Soil Phosphorus, Phosphorus Fertilizer, and Crop Yield." Communications in Soil Science and Plant Analysis 44, no. 6 (2013): 1056-1071. https://doi.org/10.1080/00103624.2012.750337.
Basso, B., J. T. Ritchie, D. Cammarano, and L. Sartori. "A Strategic and Tactical Management Approach to Select Optimal N Fertilizer Rates for Wheat in a Spatially Variable Field." European Journal of Agronomy 35, no. 4 (2011): 215-222. https://doi.org/10.1016/j.eja.2011.06.004.
Culman, S., A. Fulford, J. Camberato, K. Steinke. 2020. Tri-state fertilizer recommendations (Bulletin 974). College of Food, Agricultural, and Environmental Sciences, The Ohio State University.
Dodd, J. R., and A. P. Mallarino. "Soil-Test Phosphorus and Crop Grain Yield Responses to Long-Term Phosphorus Fertilization for Corn-Soybean Rotations." Soil Science Society of America Journal 69, no. 4 (2005): 1118-1128. https://doi.org/10.2136/sssaj2004.0279.
Drescher, G. L., N. A. Slaton, T. L. Roberts, and A. D. Smartt. "Corn Yield Response to Phosphorus and Potassium Fertilization in Arkansas." Crop, Forage & Turfgrass Management 7, no. 2 (2021): e20120. https://doi.org/10.1002/cft2.20120.
Giola, P., B. Basso, G. Pruneddu, F. Giunta, and J. W. Jones. "Impact of Manure and Slurry Applications on Soil Nitrate in a Maize–Triticale Rotation: Field Study and Long Term Simulation Analysis." European Journal of Agronomy 38 (April 2012): 43-53. https://doi.org/10.1016/j.eja.2011.12.001.
Syswerda, S. P., B. Basso, S. K. Hamilton, J. B. Tausig, and G. P. Robertson. "Long-Term Nitrate Loss Along an Agricultural Intensity Gradient in the Upper Midwest USA." Agriculture, Ecosystems & Environment 149 (March 2012): 10-19. https://doi.org/10.1016/j.agee.2011.12.007.
Sarkar, S., F. Lupi, and B. Basso. "Phosphorus Application Rates and Farmers' Perceptions of Environmental Concerns." Agricultural & Environmental Letters 10 (2025): e70014. https://doi.org/10.1002/ael2.70014.
Sarkar, S., F. Lupi, L. Price, and B. Basso. "Corn Yield Response to Phosphorus Fertilizer in Michigan: A Metamodeling Approach for Phosphorus Management Policies." Journal of Agriculture and Food Research 18 (2024a): 101410. https://doi.org/10.1016/j.jafr.2024.101410.
Sarkar, S., P. Lal, M. Sears, and F. Lupi. "Evaluating the Impact of Fertilizer and Crop Prices on Phosphorus Concentrations in Great Lakes Watersheds." Journal of the Agricultural and Applied Economics Association (2024b): 1-18. https://doi.org/10.1002/jaa2.145.
Warncke, D., J. Dahl, and L. Jacobs. Nutrient Recommendations for Field Crops in Michigan. Extension Bulletin E2904. Department of Crop and Soil Sciences, Michigan State University, 2009. https://www.canr.msu.edu/fertrec/uploads/E-2904-MSU-Nutrient-recomdns-field-crops.pdf.
Disclaimer: We request all readers, electronic media and others follow our citation guidelines when re-posting articles from farmdoc daily. Guidelines are available here. The farmdoc daily website falls under University of Illinois copyright and intellectual property rights. For a detailed statement, please see the University of Illinois Copyright Information and Policies here.