


Solvency Series: Healthy Debt-to-Asset Ratios Amid Rising Debt Servicing Costs
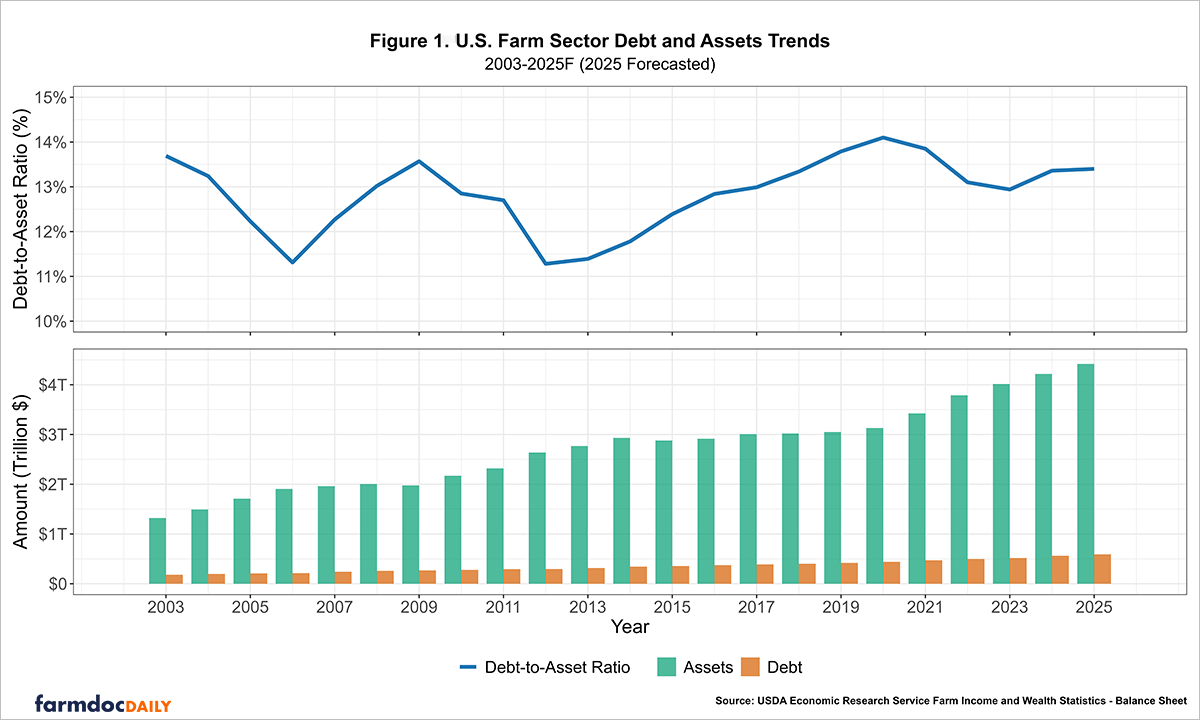
U.S. farm sector debt is projected to climb to $591.8 billion in 2025, up 5.0% from 2024, while farm sector assets are expected to increase by 4.7% to $4.42 trillion, according to the USDA’s Economic Research Service (see Farm Sector and Wealth Statistics). This translates to a debt-to-asset ratio of 13.40% in 2025 for the sector, slightly higher than 13.36% in 2024. However, the debt-to-asset ratio for the sector has remained relatively stable over the past two decades. Since 2003, farm sector debt has risen by 226.80% from $181.1 billion and assets by 234.03% from $1.32 trillion. And yet, over this period, the debt-to-asset ratio has remained within a narrow range of 11.28% to 14.1%, as shown in Figure 1 below.
Last week, the Federal Open Markets Committee (FOMC) lowered the federal funds rate by 25 basis points, setting a new target range of 4.00% to 4.25%. Despite the welcome relief for borrowers, we are still in a high-interest rate environment. Interest rates dramatically rose from near zero in March of 2022 to a peak target rate of 5.25% to 5.50% in July 2023. Many farmers have experienced higher borrowing costs as a result. Chapter 12 farm bankruptcies rose by 55% (216 filings) in 2024 compared to the previous year and are expected to trend higher this year (see Bloomberg Law, April 2025). Even so, the 2024 figure is well below the 595 filings reported in 2019 that occurred during the Trump administration’s trade war with China (see Farm Bureau Market Intel, January 2020).
Given the elevated borrowing costs farmers have faced in recent years, it is timely to examine how producers are faring financially. In today’s farmdoc daily article, we begin our series by exploring the solvency of grain farms in Illinois using data from the Farm Business Farm Management (FBFM). While the U.S farm sector figures discussed earlier would include all farm types that have a minimum of $1,000 in gross revenue, the FBFM data used in this article are from operating grain farms that have a much higher gross revenue.[1]
The debt-to-asset ratio measures farm solvency by showing the share of assets financed by debt instead of equity. Therefore, a higher ratio indicates that a greater share of the farm’s assets is financed with debt. Lenders use this ratio to evaluate a farm’s ability to meet its long-term financial obligations. According to the Center for Farm Financial Management’s Farm Financial Scorecard, a farm with a debt-to-asset ratio above 60% is categorized as vulnerable, between 30% and 60% is categorized as cautionary, and a ratio below 30% is categorized as strong.[2] Figure 2 shows how the ratio has varied across Illinois grain farms from 2023 to 2024, reported at the lower quartile, median, and upper quartile levels. Quartiles divide farms into four equal groups, and each measure provides a different perspective on the distribution of debt-to-asset ratios. The lower quartile marks the debt-to-asset ratio below which 25% of farms fall—these are the farms with the strongest solvency (lowest leverage). The median is the middle value, where half the farms have lower ratios (stronger solvency) and half have higher ones (weaker solvency). The upper quartile marks the ratio below which 75% of farms fall, meaning the top 25% of farms—the most highly leveraged ones—have even higher ratios above this point. We also use the color-coding system from the Farm Financial Scorecard to indicate the risk category the ratio falls under in a given year. The region shaded in red indicates a vulnerable ratio, yellow represents a cautionary ratio, and green indicates a strong ratio.
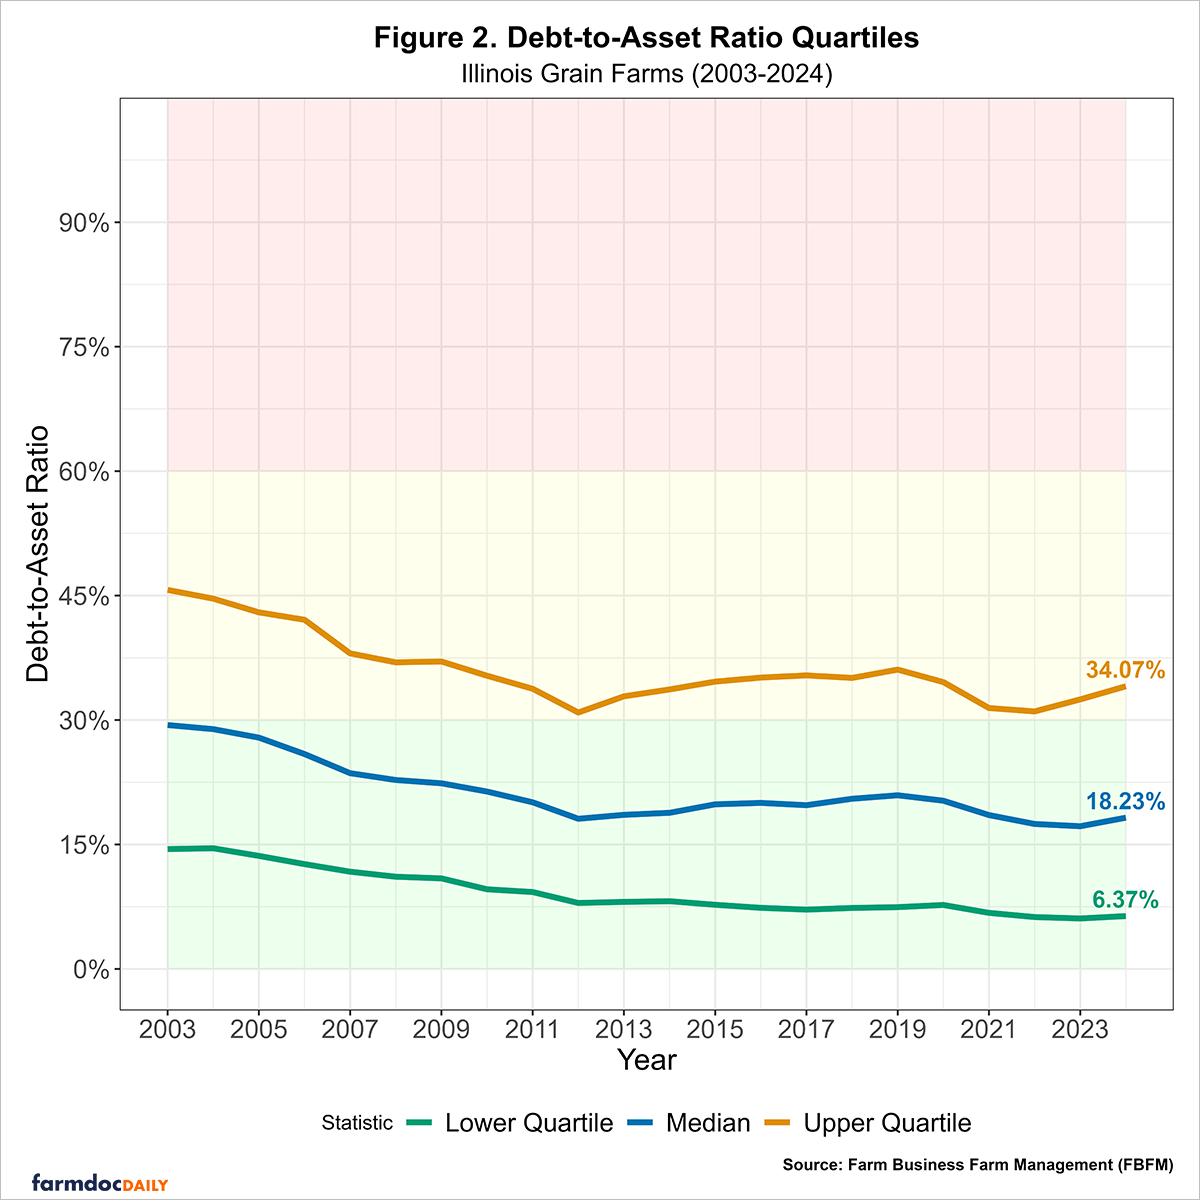
From 2003 to 2012, debt-to-asset ratios trended downward as farms reduced their leverage, primarily due to rising asset values. Even the most leveraged 25% of farms reduced debt reliance as the upper quartile fell from 45.7% (cautionary) to 30.9% (cautionary), while the median dropped from 29.4% (strong) to 18.1% (strong), indicating an improvement in financial health for the typical grain farm, and the low-debt farms further improved their equity positions as the lower quartile decreased from 14.4% (strong) to 8.0% (strong). Between 2012 and 2019, ratios stabilized with slight increases, particularly for high-debt farms, as the upper quartile rose to 36.1% (cautionary), the median to 20.9% (strong), while the lower quartile of farms held steady and improved slightly by decreasing their leverage to 7.5% (strong). There was further deleveraging from 2019 to 2022 due to record farm incomes and increasing farm assets, with the upper quartile falling to 31.0% (cautionary), the median to 17.5% (strong), and the lower quartile to 6.3% (strong). However, from 2022 to 2024, debt-to-asset ratios ticked up with much lower incomes and the need to use more operating debt even with rising intermediate and long-term asset values, with the upper quartile rising to 34.1% (cautionary), indicating an increase in debt burden for the most leveraged farms, while the median rose to 18.2% (strong). The lower quartile of grain farms remained steady at 6.4%. Overall, the distribution of the ratios across grain farms underscores how healthy grain farms are in Illinois, as the majority fall within the strong debt-to-asset ratio category.
While solvency ratios assess the health of the farm balance sheet, interest expense per tillable acre measures the direct cash flow burden of the cost of servicing debt on a per-unit basis. As with the debt-to-asset ratios, we examine this metric at the lower quartile, median, and upper quartile to understand the range of experiences among grain farms over the same period (see Figure 3). The lower quartile represents the 25 percent of farms with the lowest interest costs, the median reflects the typical farm, with half paying more and half less; and the upper quartile captures the 25 percent of farms with the highest interest costs.
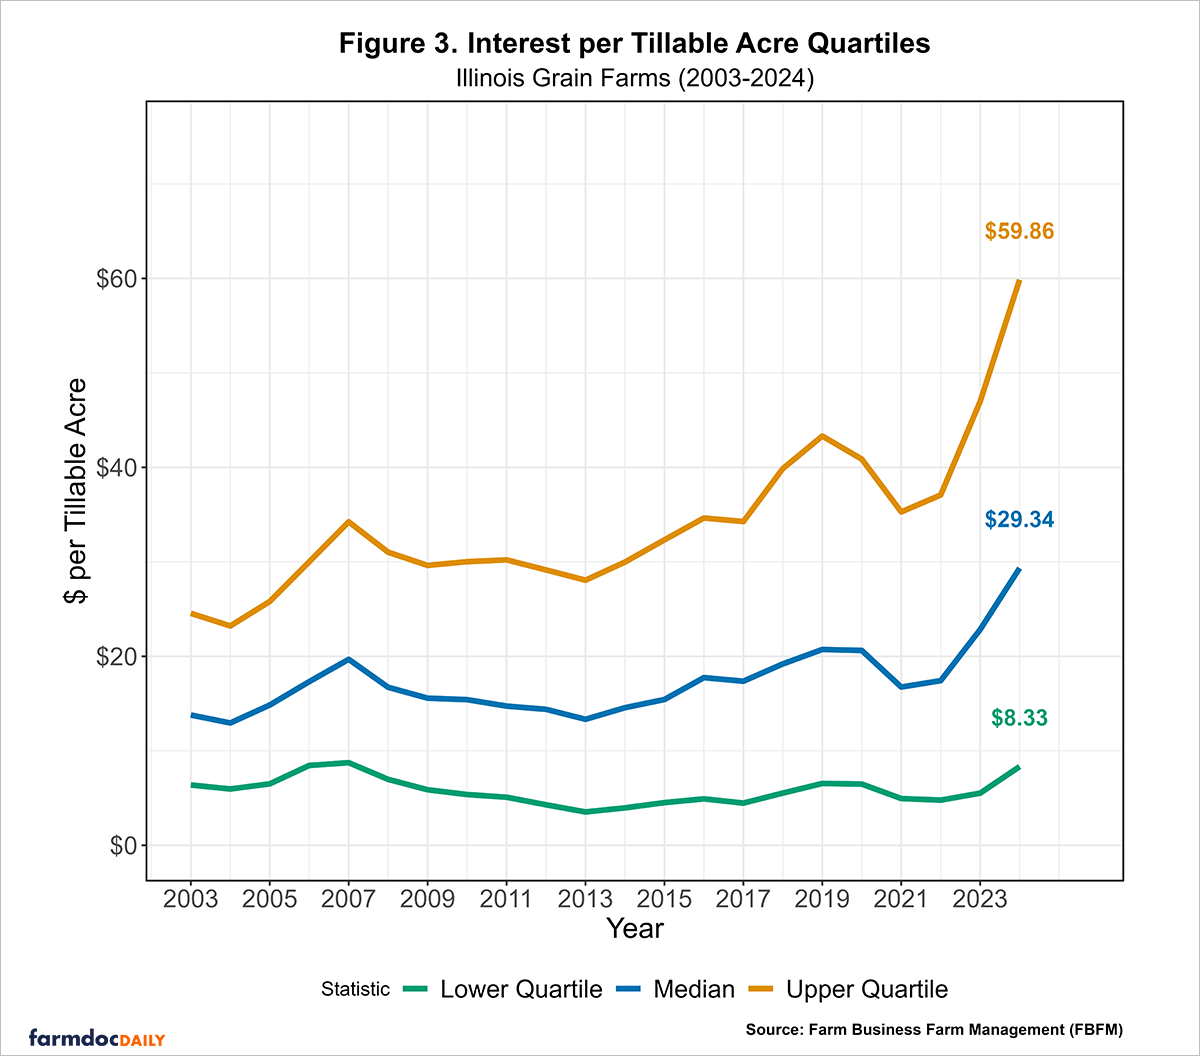
From 2003 to 2012, interest per tillable acre fell briefly then rose, peaking mid-decade as the federal funds rate rose from 1.0% in 2003 to 5.25% by 2006, then fell to near 0% by the end of 2008; the upper quartile increased from $24.55 to $34.23 per tillable acre in 2007 before declining to $29.15 by 2012, the median rose from $13.79 to $19.68 then fell to $14.39, and the lower quartile climbed from $6.38 to $8.74 before declining to $4.29, reflecting relief in interest costs for low-debt farms post-2008.
Between 2012 and 2019, interest costs rose steadily as debt grew and the federal funds rate increased from near 0% to a target range of 2.25% to 2.50% by 2019, with the upper quartile climbing from $29.15 to $43.31, signaling growing debt-servicing costs for the most indebted farms, while the median increased from $14.39 to $20.72, and the lower quartile from $4.29 to $6.54. From 2019 to 2022, borrowing costs fell as the federal funds rate dropped to 0–0.25% during the pandemic and record farm incomes reduced reliance on operating debt, with the upper quartile declining to $37.08 per tillable acre, the median to $17.42, and the lower quartile to $4.78, offering a brief relief. However, from 2022 to 2024, interest expenses surged as the federal funds rate rose sharply to 5.25–5.50% by 2023 and lower farm incomes drove greater dependence on debt, pushing the upper quartile to $59.86 per tillable acre, the median to $29.34, and the lower quartile to $8.33, highlighting the sharp rise in borrowing costs for farmers, especially for the 25% of farms carrying the heaviest debt loads.
Conclusion
Our analysis of the distribution of the debt-to-asset ratios reveals that most grain farms in Illinois have maintained ratios in the strong category (below 30%) over the past two decades. However, the recent sharp rise in interest expense per tillable acre, especially for the 25% of farms with the highest debt servicing costs, signals an increase in financial strain. With U.S. farm sector debt projected to reach $591.8 billion in 2025 and farm bankruptcies rising, farmers should prioritize diligent recordkeeping and monitor debt ratios to ensure sufficient margins for debt payments, especially as elevated borrowing costs heighten risks for highly indebted operations.
Acknowledgment
The authors would like to acknowledge that data used in this study comes from the Illinois Farm Business Farm Management (FBFM) Association. Without Illinois FBFM, information as comprehensive and accurate as this would not be available for educational purposes. FBFM, which consists of 5,000+ farmers and 70 professional field staff, is a not-for-profit organization available to all farm operators in Illinois. FBFM field staff provide on-farm counsel along with recordkeeping, farm financial management, business entity planning and income tax management. For more information, please contact our office located on the campus of the University of Illinois in the Department of Agricultural and Consumer Economics at 217-333-8346 or visit the FBFM website at www.fbfm.org.
Notes
[1] The FBFM data includes grain farms with $40,000 or more in gross farm revenues.
[2] The Farm Financial Scorecard adheres to the guidelines set by the Farm Financial Standards Council.
References
Newton, John. "The Verdict Is In: Farm Bankruptcies Up in 2019." American Farm Bureau Federation Market Intel, January 2020. https://www.fb.org/market-intel/the-verdict-is-in-farm-bankruptcies-up-in-2019.
U.S. Department of Agriculture, Economic Research Service. (2025, September 3). Farm sector income & finances: Assets, debt, and wealth.
Wolf, Alex, and Skye Witley. "Trump Policies Add to Farming Distress as Bankruptcies Increase." Bloomberg Law, April 2025. https://news.bloomberglaw.com/bankruptcy-law/trump-policies-add-to-farming-distress-as-bankruptcies-increase.
Disclaimer: We request all readers, electronic media and others follow our citation guidelines when re-posting articles from farmdoc daily. Guidelines are available here. The farmdoc daily website falls under University of Illinois copyright and intellectual property rights. For a detailed statement, please see the University of Illinois Copyright Information and Policies here.