


Solvency Series: Per Acre Economic Costs of Illinois Grain Farms by their Debt Burden
In our previous article (see farmdoc daily, October 1, 2025), we found that most farms maintained healthy solvency ratios, with debt-to-asset levels remaining relatively stable or improving over the past 6 years. However, in recent years, farms carrying the highest debt loads have seen their debt servicing costs accelerate at a faster clip relative to grain farms with lower debt burdens.
Having examined debt servicing costs and solvency trends in earlier articles, we now turn to how grain farms’ economic costs vary by debt burden using recent Illinois Farm Business Farm Management Association (FBFM) data. Economic costs represent the total cost of all resources used in farming, including both out-of-pocket expenses and opportunity costs. Unlike financial costs—which only include cash outlays—economic costs also capture what farmers forgo by using their own resources in the farm business (e.g., owned land, equity capital, and unpaid labor). As a result, economic costs are typically higher than what you would see on an income statement.
Classification of Grain Farms and Economic Cost Categories
Following the Center for Farm Financial Management’s Farm Financial Scorecard, we first classify each grain farm in our sample as having a debt-to-asset ratio that is either strong (< 30%), cautionary (30-60%), or vulnerable (> 60%) over the 2022-2024 period[1]. We then calculate median per-acre values across six economic cost categories: (1) Crop costs – fertilizer, seed, and pesticides; (2) Power costs – utilities, machinery repairs, machine hire, fuel, machinery depreciation, and light vehicles; (3) Building costs – drying, storage, building repair, and building depreciation; (4) Labor costs – paid and unpaid labor; (5) Overhead costs – veterinary and livestock expenses, insurance, miscellaneous expenses, non-land interest, and general overhead; and (6) Land costs – land interest, taxes, cash rent, and share-rent leasing costs.
Grain Farms in the Strong Category
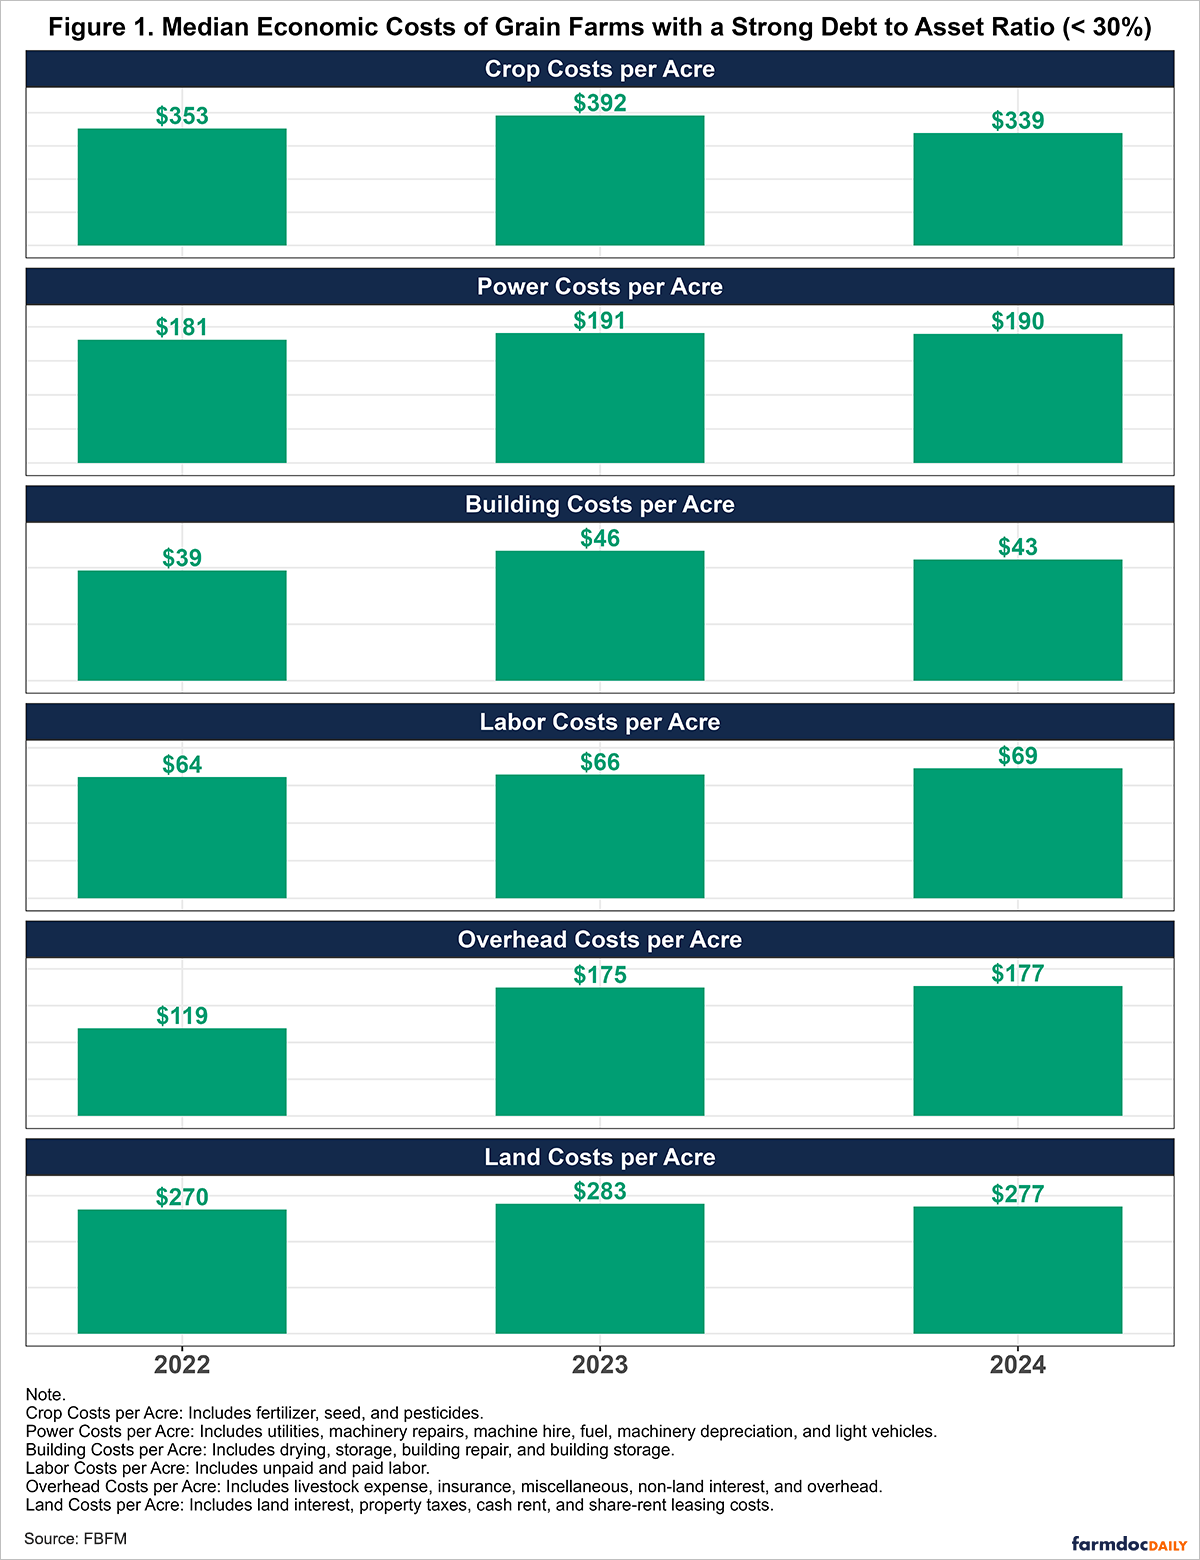
Figure 1 shows the median economic costs of grain farms with a strong (< 30%) debt-to-asset ratio from 2022 to 2024. These farms represented approximately 70-73% of grain farms each year. Total costs increased by 12 percent from $1,054 in 2022 to $1,177 in 2023, before declining by 5 percent to $1,117 in 2024. Crop costs, the largest expense category, rose by 11 percent from $353 to $392 initially, then decreased 14 percent to $339 in 2024, mainly due to lower fertility costs. Land costs, the second-largest category, increased 5% from $270 to $283 before falling to $277. Power costs also increased, rising from $181 in 2022 to $188 in 2024. With the non-land interest charge increasing from 4.0% to 7.5% in 2023 and then 8.0% in 2024, overhead costs rose substantially by 48% from $119 to $177 over the period. On the other hand, labor costs increased modestly from $64 to $69 per acre. Building costs, the smallest expense category, ranged between $39-$46 per acre across the three-year period.
Grain Farms in the Cautionary Category
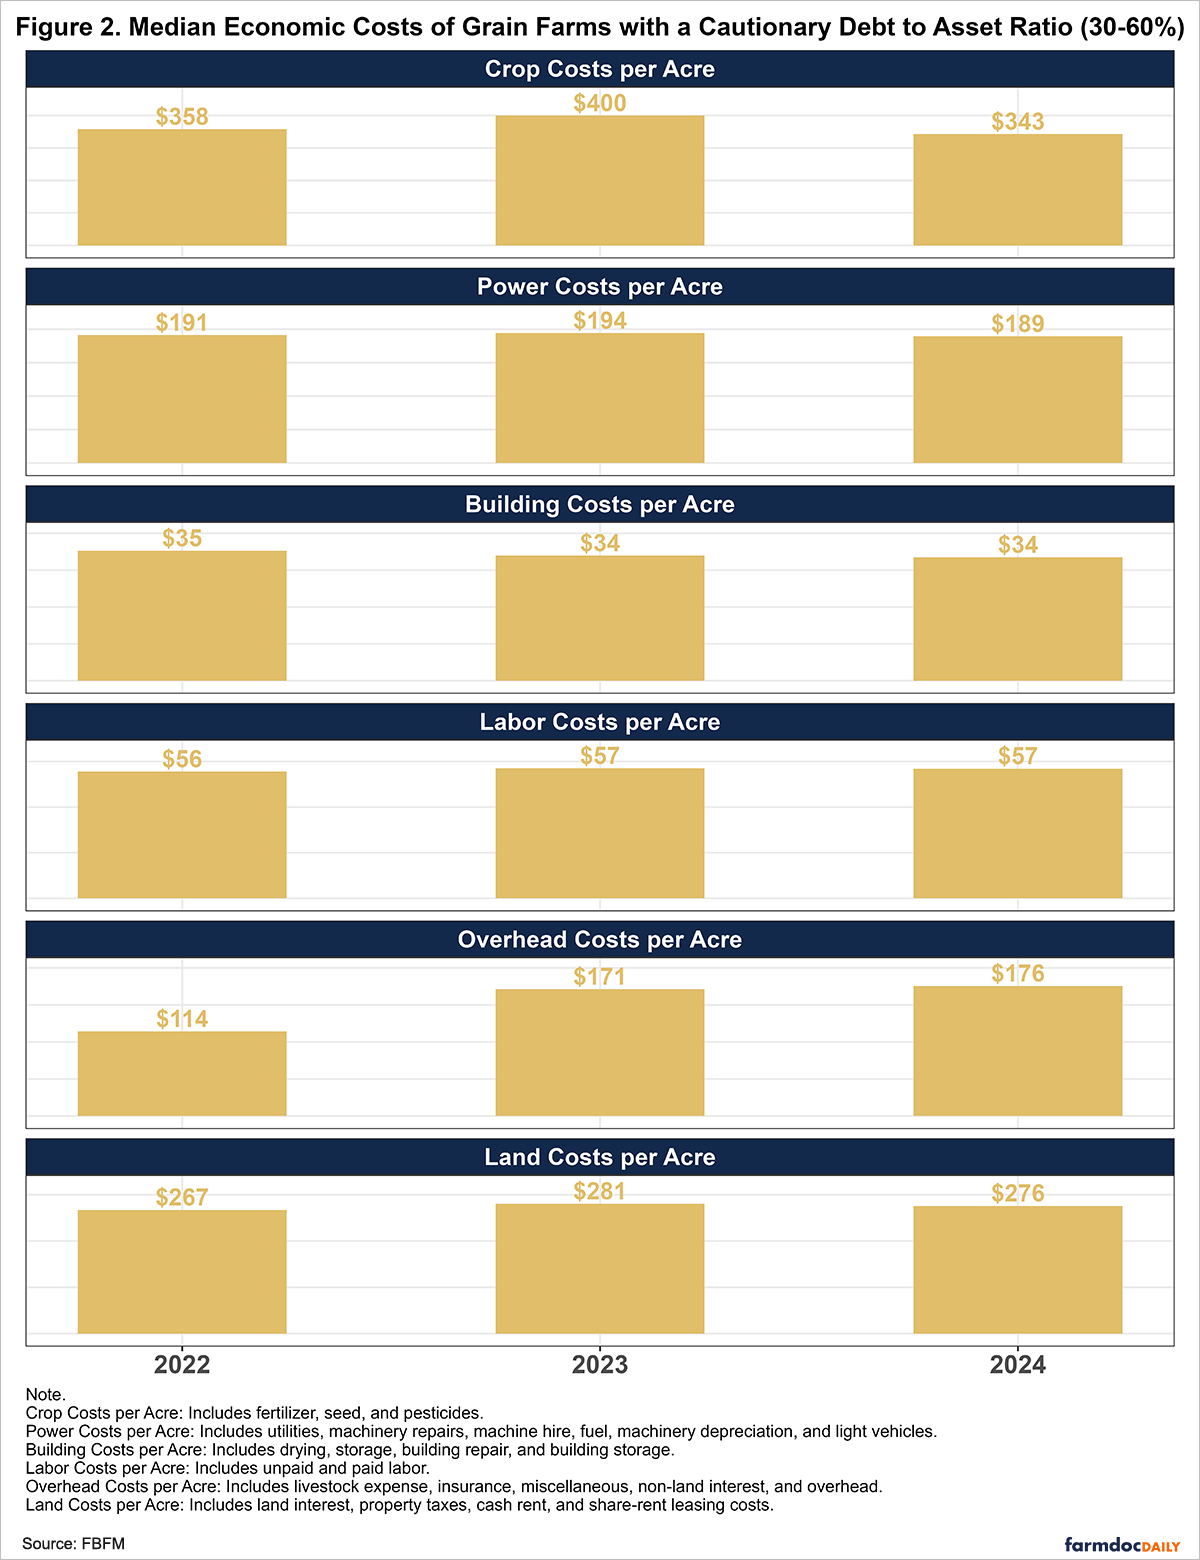
Figure 2 shows the median economic costs per acre for grain farms with a cautionary (30-60%) debt-to-asset ratio, which made up about one-quarter of the farms in each year. Total costs rose by 11 percent from $1,052 in 2022 to $1,167 in 2023, before falling by 6 percent to $1,097 in 2024. Crop costs increased 11.8 percent from $358 to $400 in the first year and fell 14.3 percent to $343. Overhead costs rose sharply by about 53 percent from $114 to $176. Land costs rose by 3.4 percent from $267 to $276, having peaked at $281 in 2023, while power, building, and labor costs demonstrated limited variation across the period.
Grain Farms in the Vulnerable Category
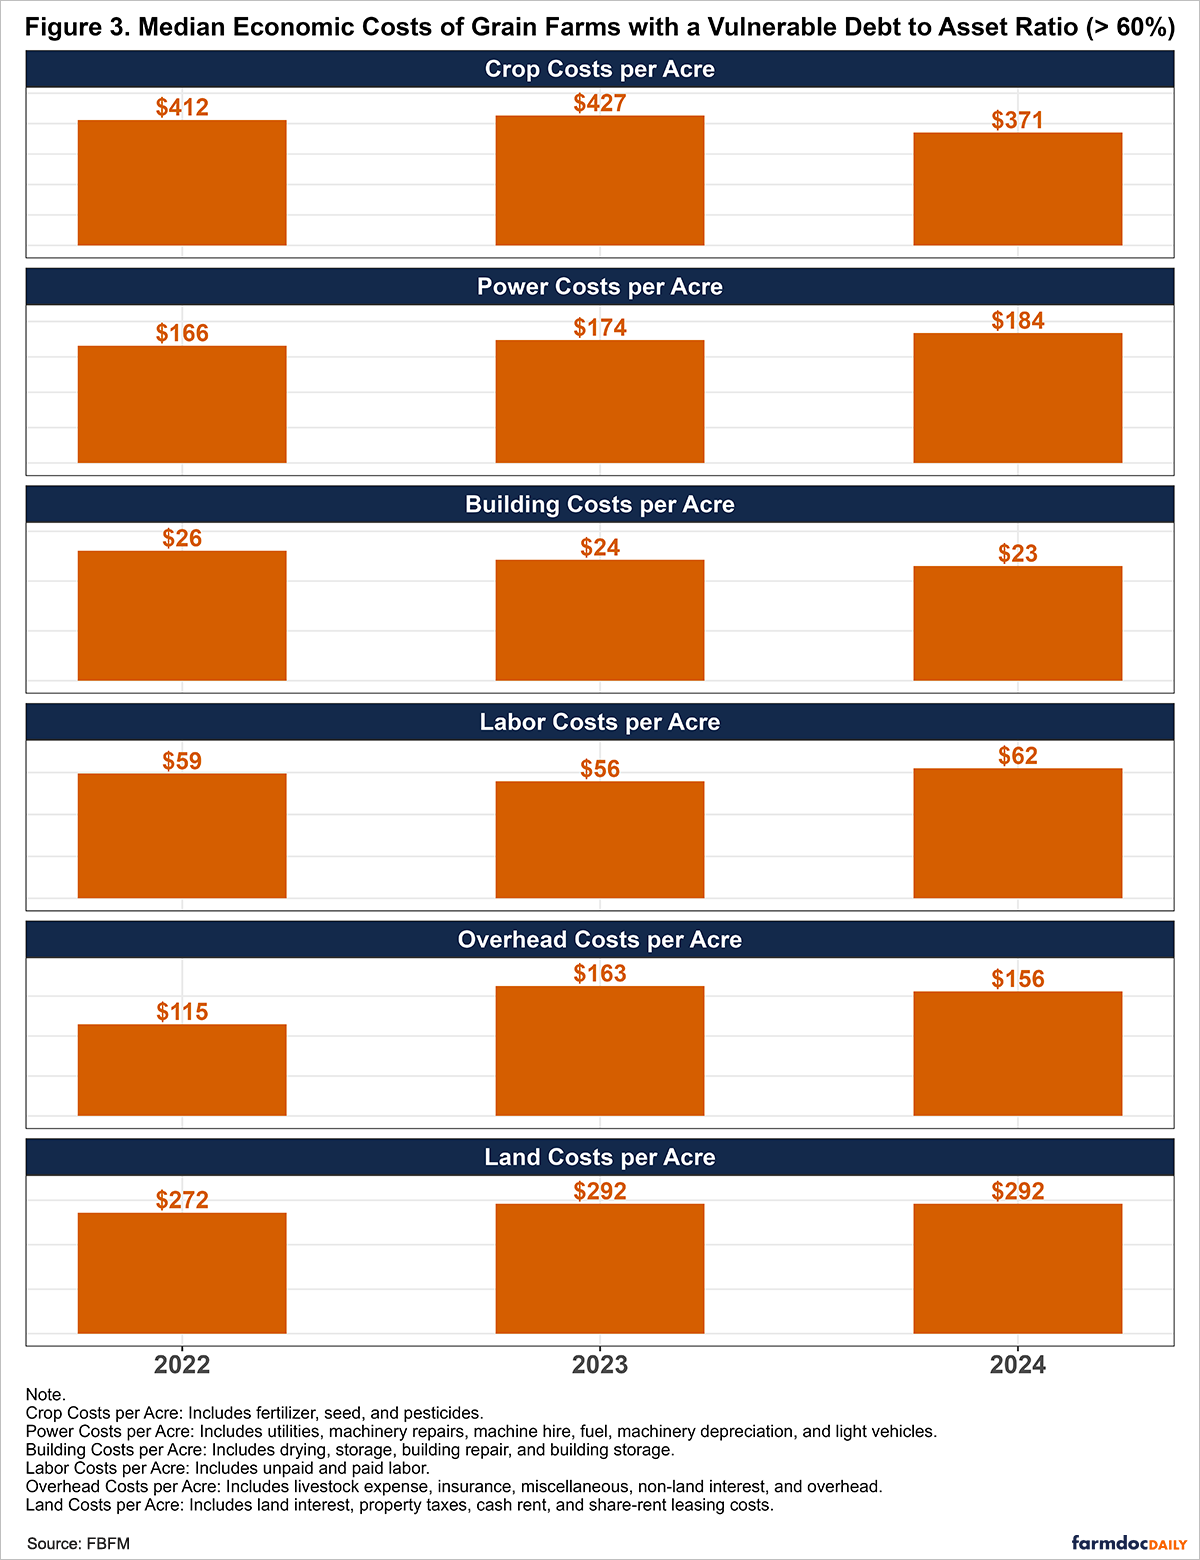
Figure 3 illustrates the median economic costs per acre for grain farms with a vulnerable (> 60%) debt-to-asset ratio, which represented a small but growing share of our sample, rising from approximately 1.65 percent in 2022 to 3.75 percent in 2024. Median total costs increased modestly by 0.62% percent from $1,127 in 2022 to $1,134 in 2023, before declining by 1.68 percent to $1,115 in 2024. Crop costs began at $412 in 2022, increased to $427 in 2023, and then fell to $371 in 2024. Power costs rose over the period from $166 in 2022 to $184 in 2024. Land costs also rose from $272 in 2022 to $292 in 2023 and then leveled off. Overhead expenses increased from $115 in 2022 to $163 in 2023 before falling to $156 in 2024. Building costs declined from $26 in 2022 to $23 in 2024, while labor costs rose from $59 in 2022 to $62 in 2024.
Conclusion
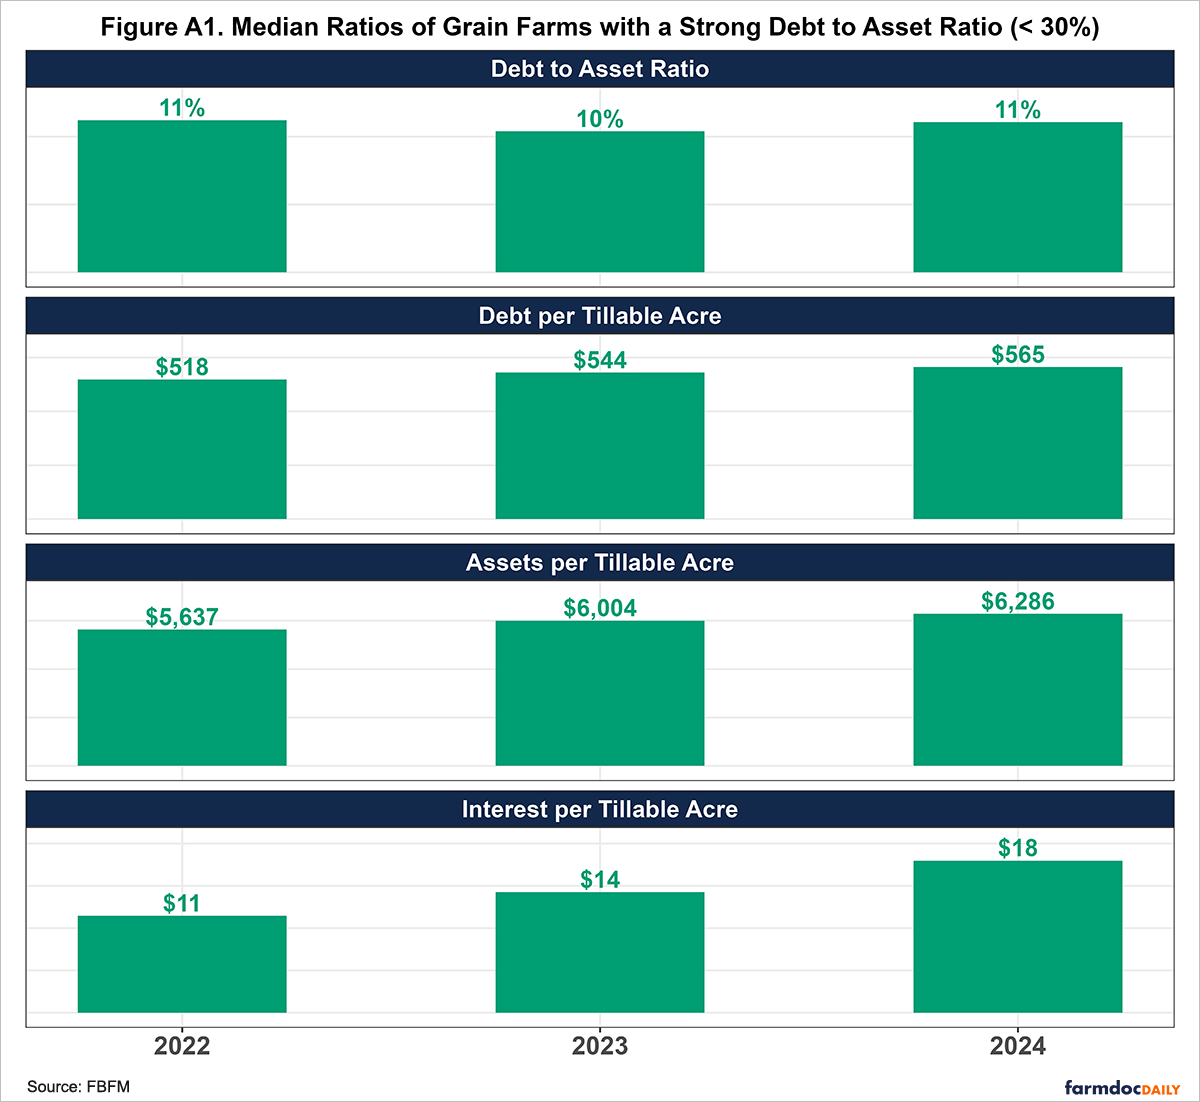
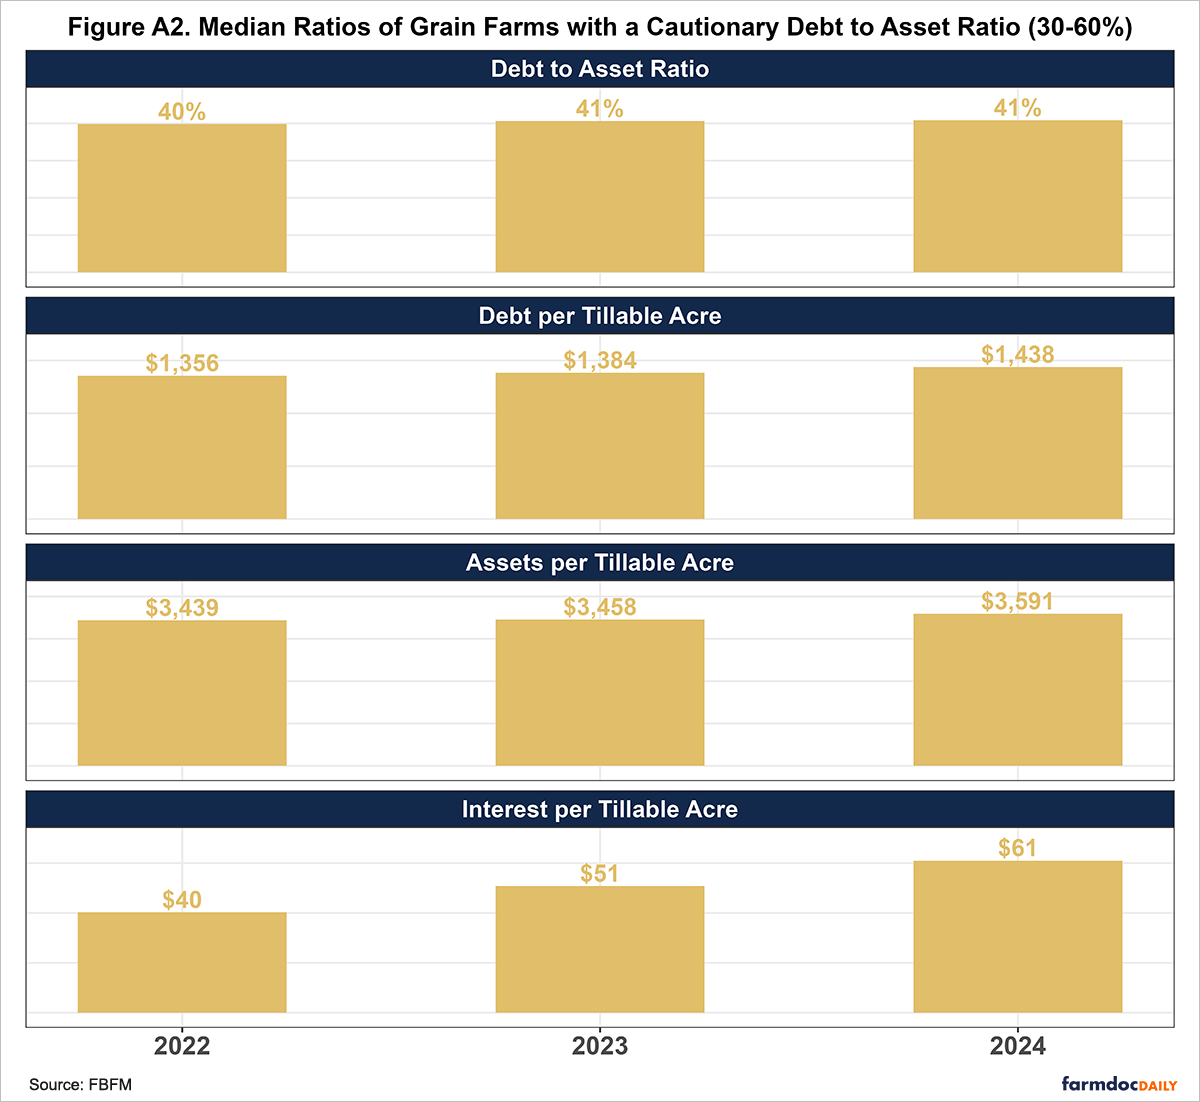
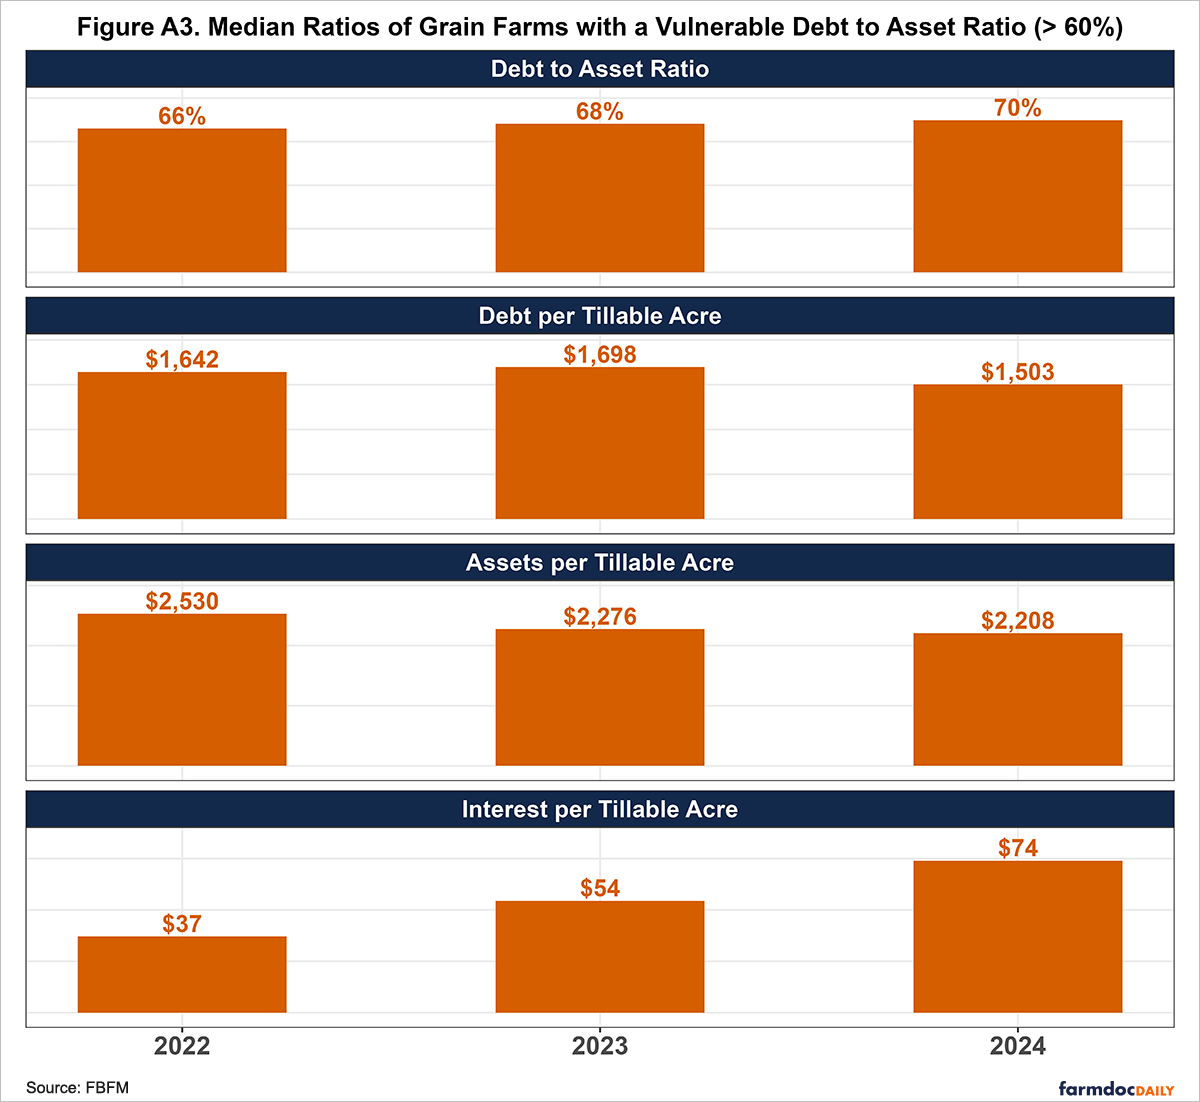
As shown in Figure 4, grain farms in 2024 with a strong debt-to-asset ratio (< 30%) had the highest median total economic costs at $1,117 per acre. These farms likely have higher economic costs since they own more assets, leading to greater interest charges for land and non-land items (see Appendix Figures A1 to A3). In contrast, farms in the cautionary category (30-60%) had the lowest total costs at $1,097 per acre, while vulnerable farms (> 60%) were slightly higher at $1,115 per acre.
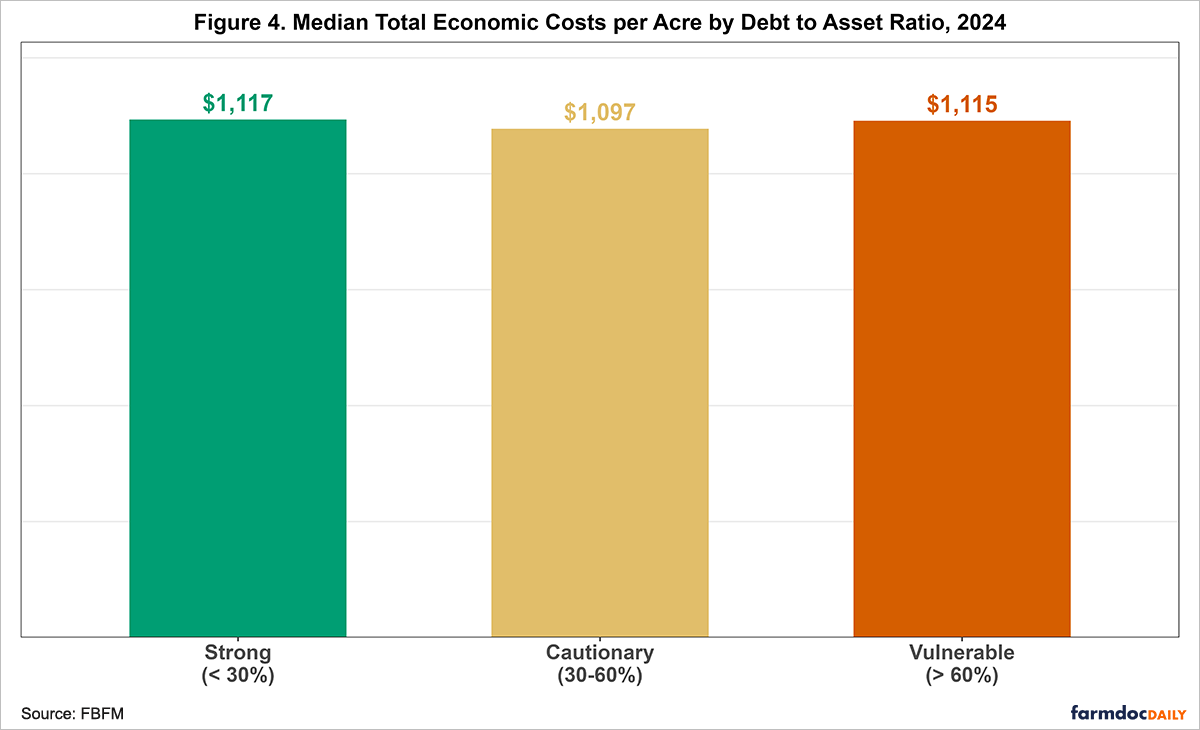
A breakdown of expenses reveals that strong farms also had the highest labor ($69/acre) and overhead costs ($177/acre). Conversely, vulnerable farms reported the highest crop costs at $371 per acre and the highest land costs at $292 per acre, which include an economic charge for owned landed and rental costs.
In summary, although farms in the vulnerable group did not have the highest total economic costs in 2024, they did have the highest crop and land costs. To improve their financial position, vulnerable farms should analyze these specific expenses to find potential savings, such as changing crop rotations, capturing early purchase discounts, or letting go of high-cost land (rental or ownership).
Acknowledgment
The authors would like to acknowledge that data used in this study comes from the Illinois Farm Business Farm Management (FBFM) Association. Without Illinois FBFM, information as comprehensive and accurate as this would not be available for educational purposes. FBFM, which consists of 5,000+ farmers and 70 professional field staff, is a not-for-profit organization available to all farm operators in Illinois. FBFM field staff provide on-farm counsel along with recordkeeping, farm financial management, business entity planning and income tax management. For more information, please contact our office located on the campus of the University of Illinois in the Department of Agricultural and Consumer Economics at 217-333-8346 or visit the FBFM website at www.fbfm.org.
Note
[1] The Farm Financial Scorecard adheres to the guidelines set by the Farm Financial Standards Council.
References
Mashange, G. and B. Zwilling. "Solvency Series: Debt Related Characteristics of Grain Farms by Debt Service Costs in 2024." farmdoc daily (15):180, Department of Agricultural and Consumer Economics, University of Illinois at Urbana-Champaign, October 1, 2025.
Appendices
Disclaimer: We request all readers, electronic media and others follow our citation guidelines when re-posting articles from farmdoc daily. Guidelines are available here. The farmdoc daily website falls under University of Illinois copyright and intellectual property rights. For a detailed statement, please see the University of Illinois Copyright Information and Policies here.