


Solvency Series: Per Acre Gross Farm and Management Returns of Illinois Grain Farms by their Debt Burden
We conclude our solvency series by examining how gross farm and management returns have varied by debt burden in recent years, along with their economic costs. In our previous article (see farmdoc daily, October 10, 2025), we reported how total economic costs differed across farms grouped into three risk categories of the debt-to-asset ratio, as defined by the Center for Farm Financial Management’s Farm Financial Scorecard. Economic costs represent the total value of all resources used in farming, encompassing both cash expenses and opportunity costs. Unlike financial costs—which capture only cash outlays—economic costs also include the returns farmers forgo by using their own resources in production, such as owned land, equity capital, and unpaid labor. As a result, economic costs are typically higher than what appears on a conventional income statement. Our analysis showed that farms with a strong debt-to-asset ratio (< 30%) had the highest median total economic costs in 2024, at $1,117 per acre. These farms likely faced higher costs because they owned more assets, resulting in greater interest charges for both land and non-land items. Farms in the cautionary category (30–60%) had the lowest total costs at $1,097 per acre, while those in the vulnerable category (> 60%) were slightly higher at $1,115 per acre. Cost line items also varied across groups. Strong farms incurred the highest labor ($69/acre) and overhead ($177/acre) costs, whereas vulnerable farms faced the highest crop ($371/acre) and land ($292/acre) costs. Although vulnerable farms did not have the highest total economic costs overall, their elevated crop and land expenses highlight key areas for improving efficiency—such as adjusting crop rotations, capturing early purchase discounts, or reducing exposure to high-cost rented or owned land.
Building on these findings, we now conclude our analysis with a high-level summary of median gross farm returns, total economic costs, and management returns per acre from 2022 to 2024, using data from the Illinois Farm Business Farm Management Association (FBFM). Gross farm returns are the accrual amount that not only includes cash receipts, but also the change in inventory and accounts receivable. We obtain management returns by taking these gross farm returns and subtracting the economic non-feed costs. Another way to define management returns is taking the accrual net farm income minus a charge for interest on equity capital and unpaid labor. What remains is the operators return to managing the operation.
Grain Farms in the Strong Debt-to-Asset Ratio Category
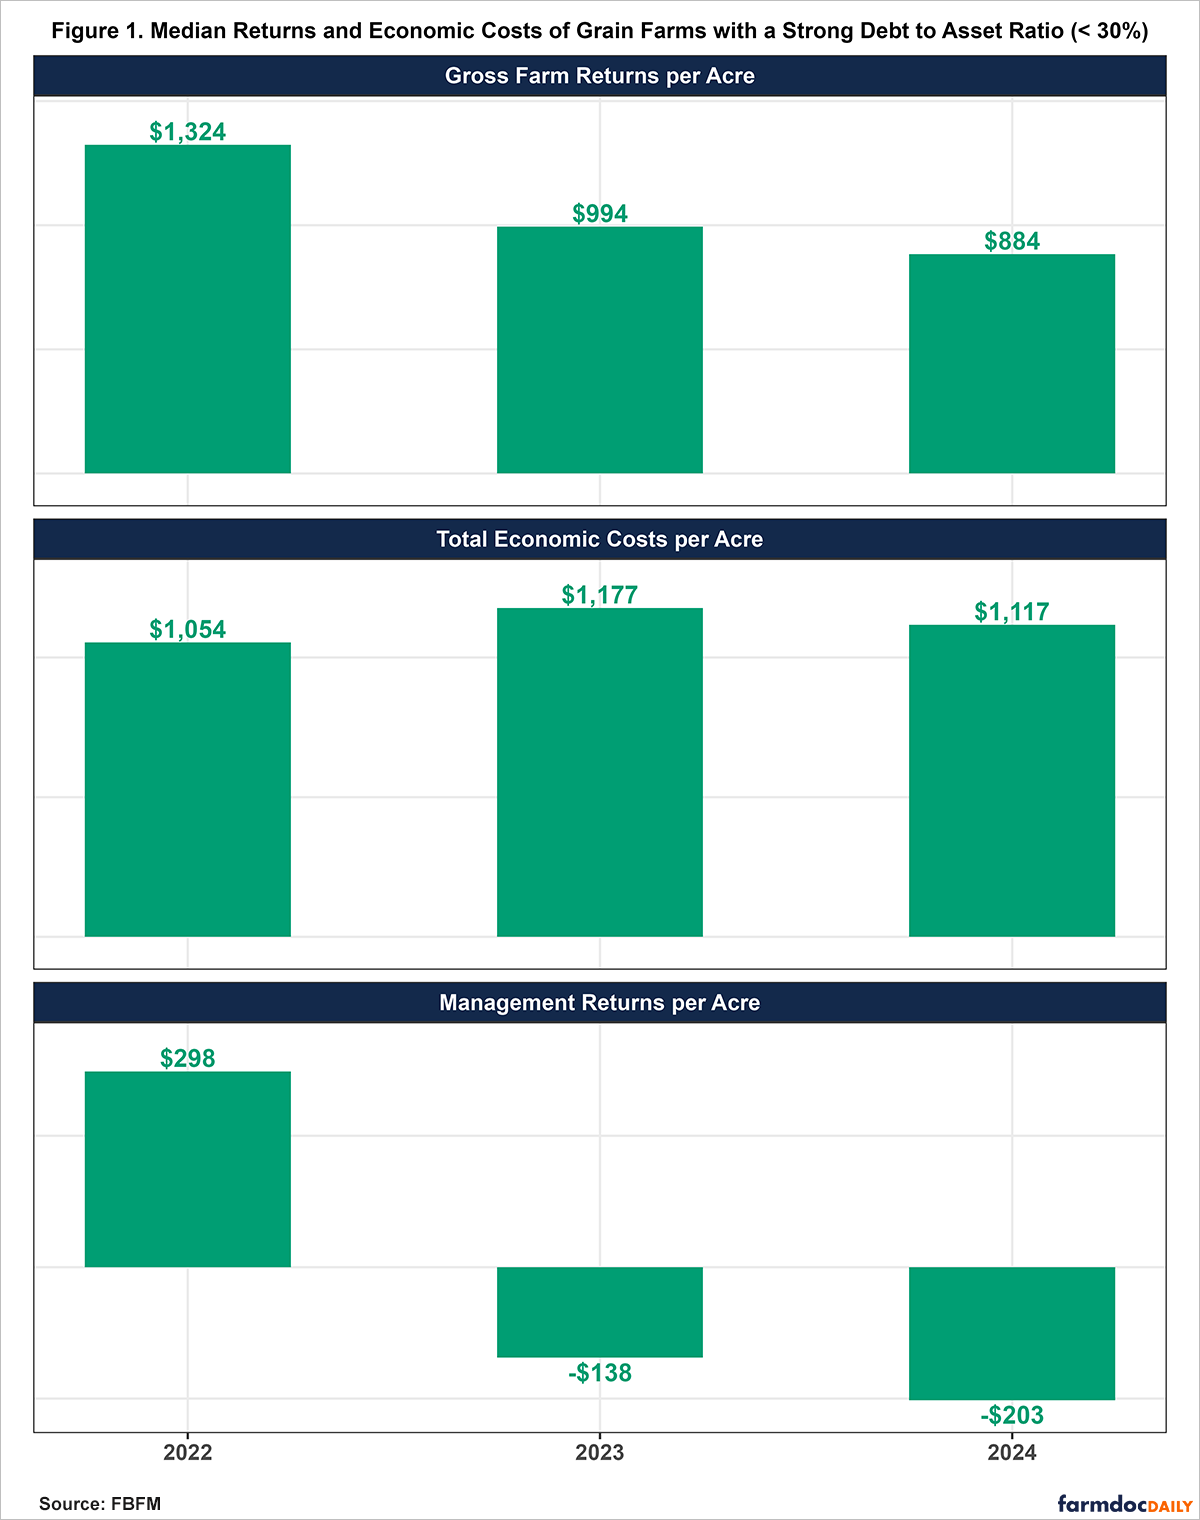
Figure 1 shows the median gross farm returns, total economic costs, and management returns for grain farms with a strong debt-to-asset ratio (< 30%) from 2022 to 2024. These farms accounted for approximately 70% of all grain farms in each year. Median gross farm returns have declined steadily since 2022, reaching $884 per acre in 2024. At the same time, total economic costs increased from $1,054 per acre in 2022 to $1,117 per acre in 2024. Taken together, this decline in gross farm returns and rise in economic costs led to a sharp decline in management returns, which fell from $298 per acre in 2022 to –$203 per acre in 2024.
Grain Farms in the Cautionary Debt-to-Asset Ratio Category
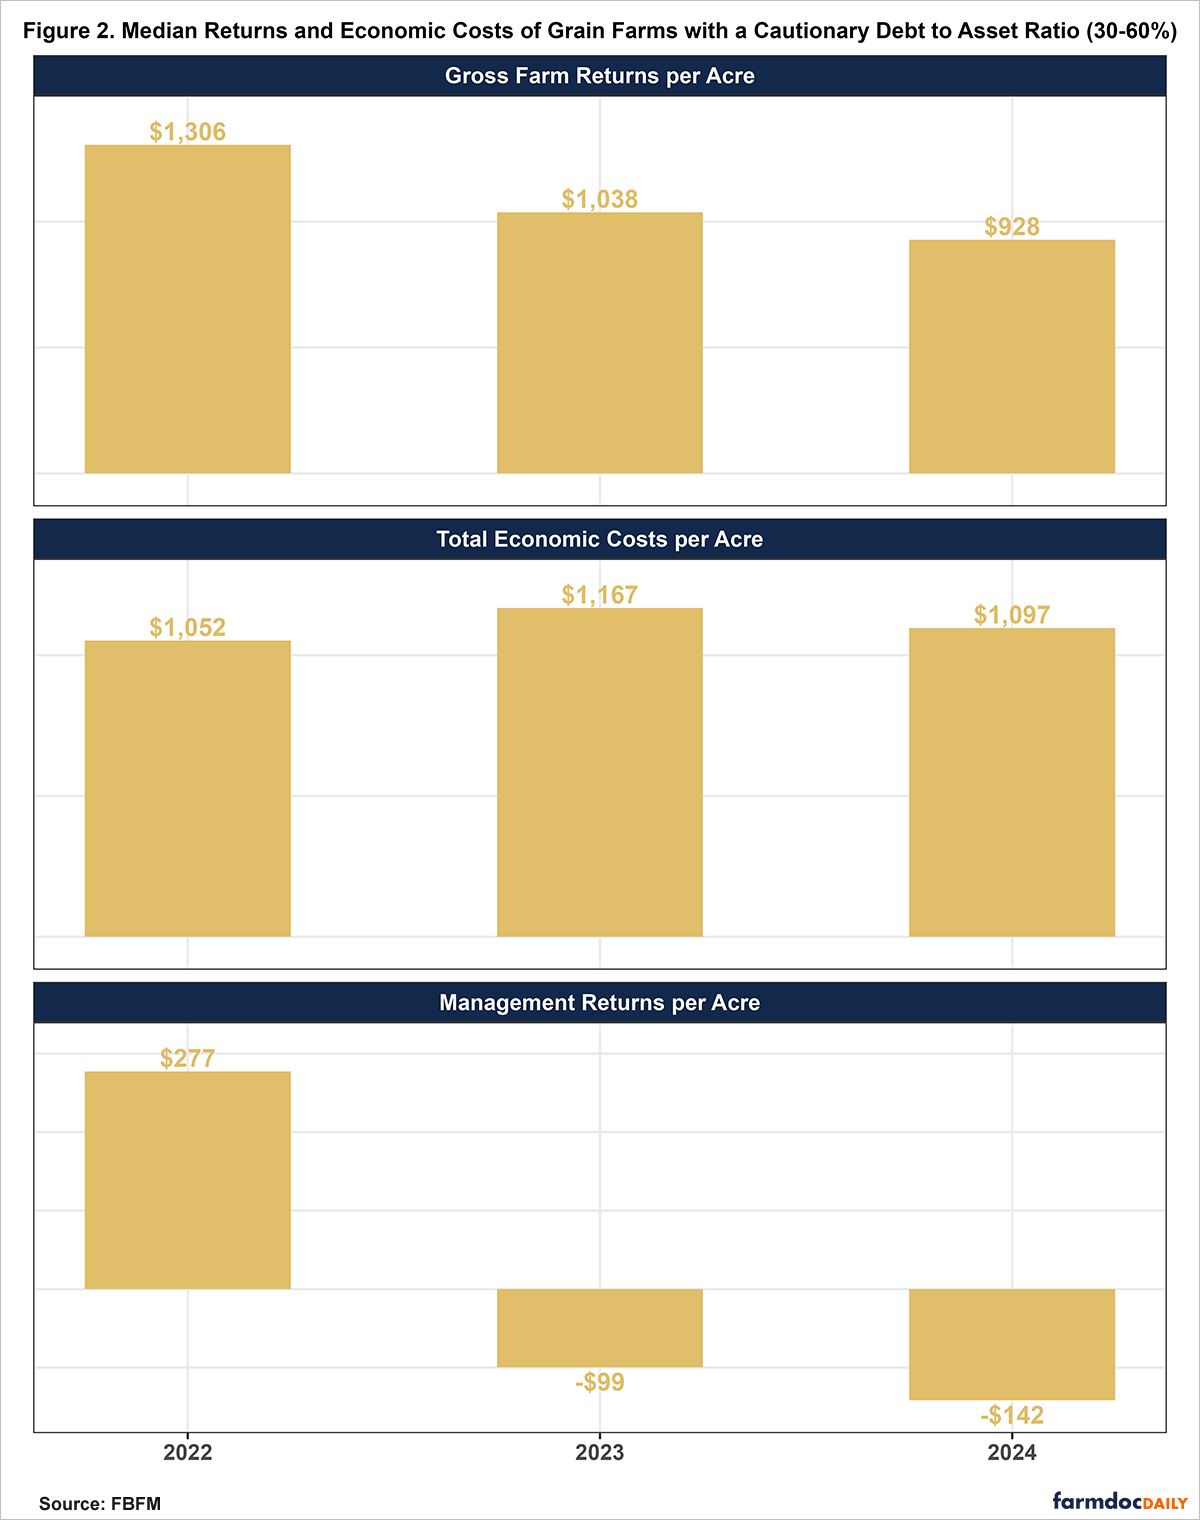
Grain farms in the cautionary category, with a debt-to-asset ratio between 30% and 60%, represented approximately 25% of all grain farms in each year. Figure 2 shows that median gross farm returns declined from $1,306 per acre in 2022 to $928 per acre in 2024, ending higher than those of strong farms in 2024. Meanwhile, total economic costs increased from $1,052 per acre in 2022 to $1,097 per acre in 2024. As a result, median management returns fell from $277 per acre in 2022 to –$142 per acre in 2024, though this decline was less severe than what was observed for strong grain farms.
Grain Farms in the Vulnerable Debt-to-Asset Ratio Category
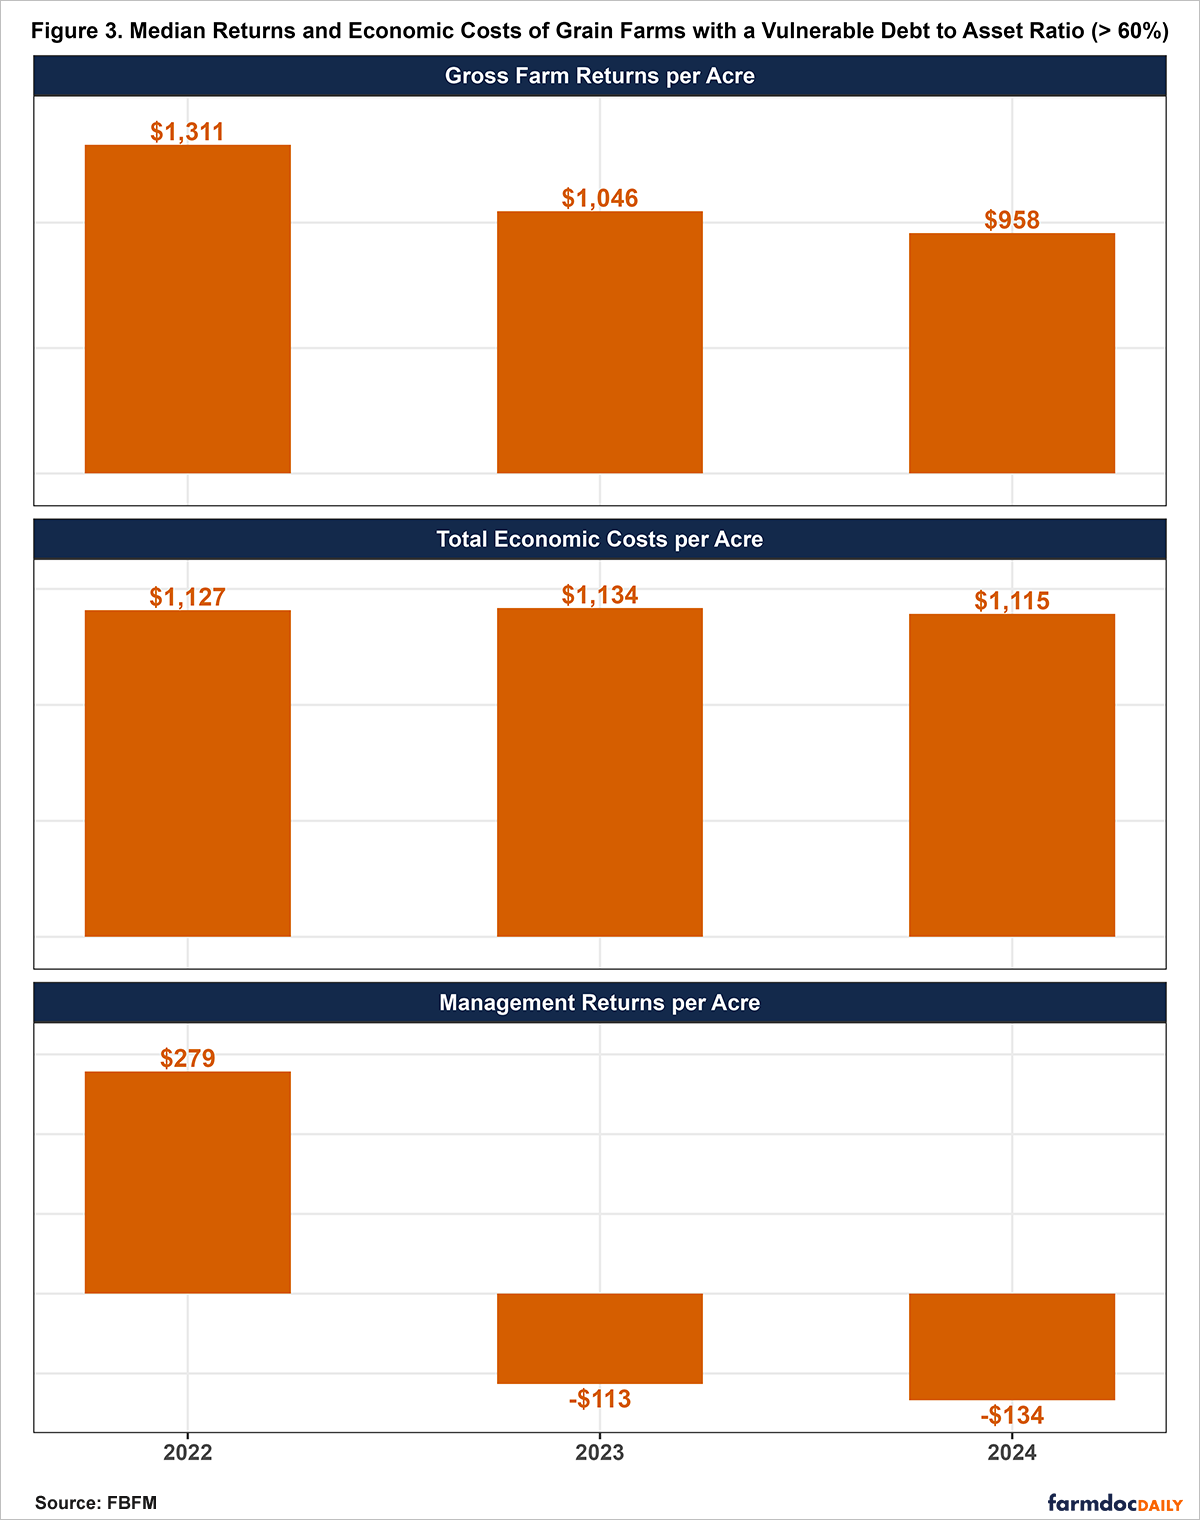
Figure 3 shows median gross farm returns, total economic costs, and management returns for grain farms with a vulnerable debt-to-asset ratio (greater than 60%) from 2022 to 2024. Although these farms account for a small share of all grain operations, their representation has increased from about 1.65 percent in 2022 to 3.75 percent in 2024. Median gross farm returns for vulnerable farms declined from $1,311 per acre in 2022 to $958 per acre in 2024. Despite this drop, their 2024 returns remained higher than those of farms in the strong ($884) and cautionary ($928) categories. Median total economic costs also decreased modestly, from $1,127 per acre in 2022 to $1,115 per acre in 2024—slightly below strong farms ($1,117) but above those in the cautionary group ($1,097). Lastly, median management returns fell from $279 per acre in 2022 to -$134 per acre in 2024, the least negative among all debt-to-asset ratio categories; by comparison, median management returns for strong and cautionary farms were -$203 and -$142, respectively.
Conclusion
In summary, median management returns declined sharply across all debt categories from 2022 to 2024, but the pattern of decline varied meaningfully by financial position. Strong grain farms (< 30% debt-to-asset ratio) experienced the steepest drop, followed by cautionary farms (30–60%), while vulnerable farms (> 60%) reported the smallest decline. By 2024, vulnerable farms—despite their higher leverage—earned both the highest gross farm returns per acre and the least negative management returns among all groups. They were also the only group to reduce their total economic costs per acre over the period. These findings are not surprising when looking at management returns. As noted in the appendix of our previous article (see farmdoc daily, October 10, 2025), the vulnerable farms have the highest debt and interest per tillable acre. Additionally, these vulnerable farms have larger amounts of interest expense than the amount of economic interest charged on owned assets. Economic total costs use economic interest charged on owned assets. Therefore, vulnerable farms will have lower economic costs. This helps explain why farms in the vulnerable group have higher management returns in 2023 and 2024 than the grain farms in the strong group. In 2024, farms in the strong group held nearly three times more assets per acre than those in the vulnerable group but paid less than one-fourth as much interest expense per acre. Greater asset ownership results in a larger economic interest charge, which contributes to the higher total economic costs observed for strong grain farms. When we look at 2022, when interest rates were lower, the strong grain farms had the highest gross farm and management returns compared to those categorized as cautionary and vulnerable.
Acknowledgment
The authors would like to acknowledge that data used in this study comes from the Illinois Farm Business Farm Management (FBFM) Association. Without Illinois FBFM, information as comprehensive and accurate as this would not be available for educational purposes. FBFM, which consists of 5,000+ farmers and 70 professional field staff, is a not-for-profit organization available to all farm operators in Illinois. FBFM field staff provide on-farm counsel along with recordkeeping, farm financial management, business entity planning and income tax management. For more information, please contact our office located on the campus of the University of Illinois in the Department of Agricultural and Consumer Economics at 217-333-8346 or visit the FBFM website at www.fbfm.org.
References
Mashange, G. and B. Zwilling. "Solvency Series: Per Acre Economic Costs of Illinois Grain Farms by their Debt Burden." farmdoc daily (15):187, Department of Agricultural and Consumer Economics, University of Illinois at Urbana-Champaign, October 10, 2025.
Disclaimer: We request all readers, electronic media and others follow our citation guidelines when re-posting articles from farmdoc daily. Guidelines are available here. The farmdoc daily website falls under University of Illinois copyright and intellectual property rights. For a detailed statement, please see the University of Illinois Copyright Information and Policies here.