


What the Numbers Say: Examining the Decline in Capital Replacement and Term Debt Repayment Margins for Illinois Grain Farms
The farm machinery and equipment market faces several headwinds. Unit sales and inventory levels are down, as manufacturers scale back production in response to weak demand. At the same time, there are signs of deteriorating credit quality at captive finance arms—such as John Deere Capital Corporation and CNH Industrial Capital LLC—alongside a softening in loan volumes at commercial banks to finance these purchases (see farmdoc daily, October 24, 2025). Together, these factors point to a challenging environment for dealers, manufacturers, and producers.
In this article, we focus on the producer and extend our analysis by examining the Capital Replacement and Term Debt Repayment Margin (CRTDR margin) using data from the Illinois Farm Business Farm Management Association (FBFM). This repayment capacity measure represents the funds remaining after covering family living expenses, taxes, and principal and interest payments on term debt and/or capital leases in order to demonstrate a producer’s ability to replace capital assets, such as farm machinery and equipment, or take on additional term debt with maturities greater than one year. Since the CRTDR margin is a dollar value and is impacted by the production and scale of the farm enterprise, along with the producer’s management abilities, it cannot be compared across farm businesses nor can it be standardized into quality scores (i.e., we cannot score it as vulnerable, satisfactory, or strong). For our analysis, however, we will simply report the quartile levels of the CRTDR margin for grain farms only to illustrate its general distribution and how it varies by the scale of the operation. Importantly, what is revealed in this article is the substantial reduction in repayment capacity in recent years, which partly helps us explain some of the issues we’ve seen in the farm machinery and equipment market from the perspective of borrowers.
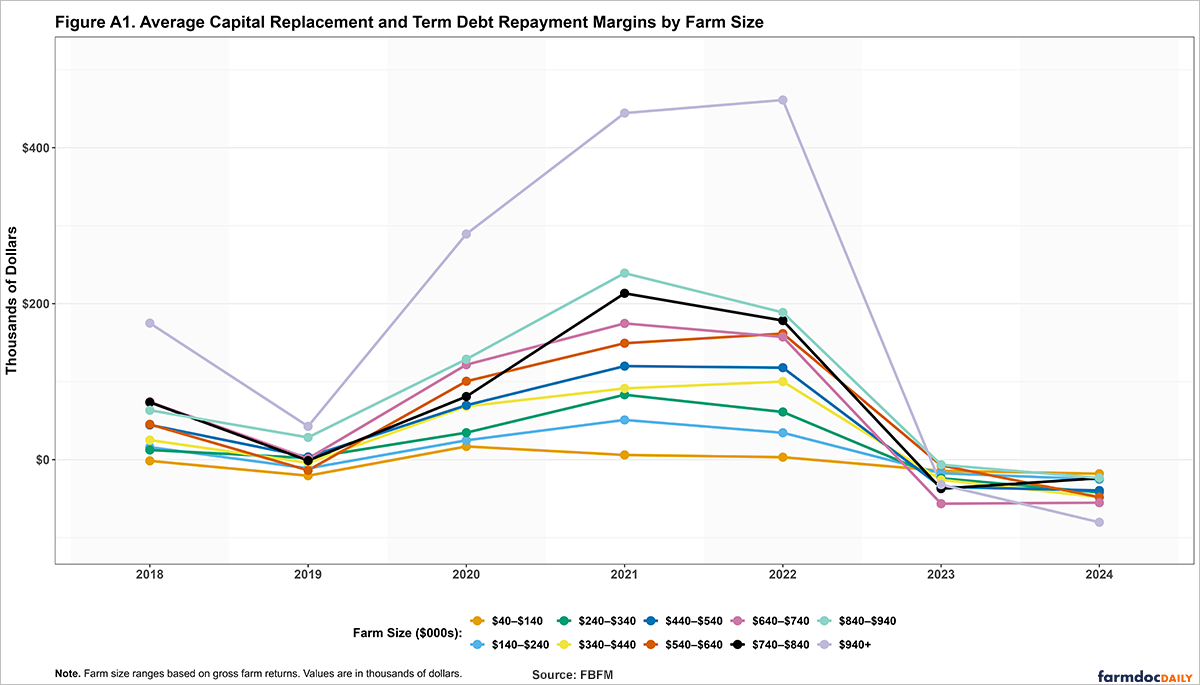
To do this, we compare the lower-quartile, median, and upper-quartile values of this measure across small, medium-sized, and large grain farms. We define small grain farms as those with gross farm returns less than $350,000, medium-sized farms as those with returns between $350,000 and $999,999, and large farms as those with returns greater than $999,999. The lower quartile is the 25th percentile—the value below which one-quarter of grain farms’ CRTDR margins fall. The median (50th percentile) marks the midpoint, and the upper quartile (75th percentile) is the point above which one-quarter of grain farms’ CRTDR margins fall. Taken together, the quartiles summarize the distribution of the CRTDR margin from more constrained (lower quartile) to more unconstrained (upper quartile) operations. A figure showing average CRTDR margins across more granular farm size categories is provided in the appendix.
Small Grain Farms
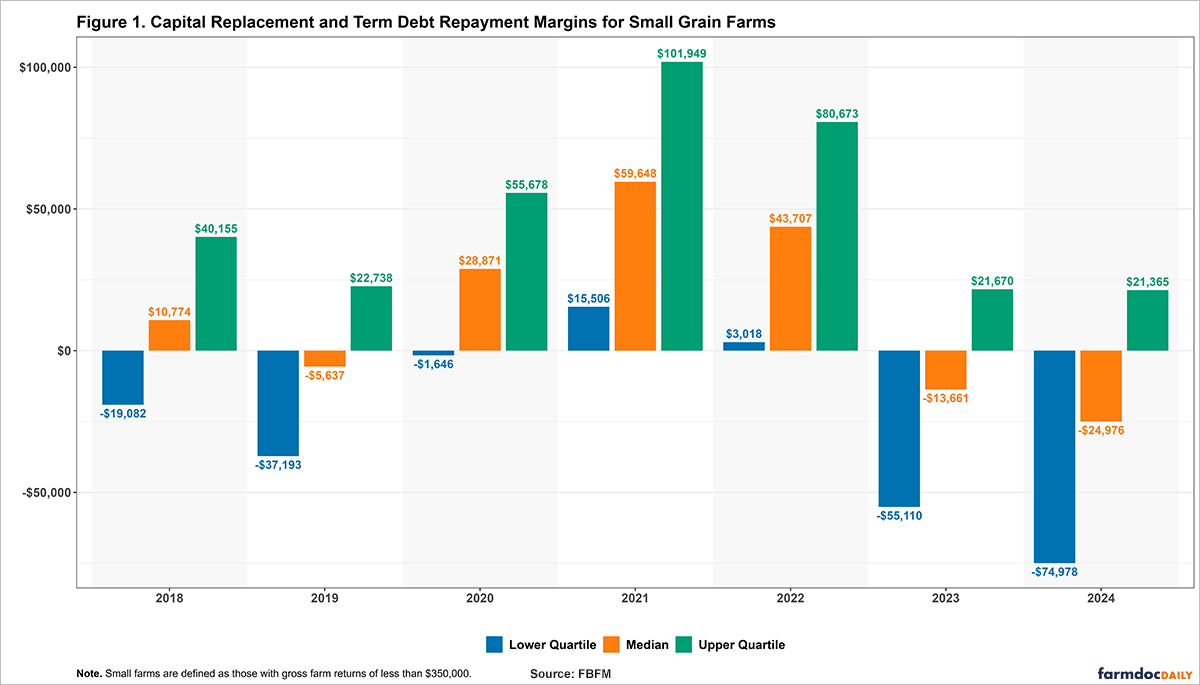
Figure 1 shows the CRTDR margin for small grain farms from 2018 to 2024. The 25th percentile (lower quartile) mainly remained negative throughout the period, reflecting limited repayment capacity for the most financially constrained operations. Although it briefly turned positive between 2021 and 2022 due to record net farm incomes during this time, this improvement was modest and short-lived, with values well below those at the median and upper quartile levels. After peaking at $15,506 in 2021, the lower quartile CRTDR margin dropped sharply to -$55,110 in 2023 and continued to decline to -$74,978 in 2024. The combined average net farm income for 2023 and 2024 was the lowest two-year number since 2015 and 2016. The median margin exhibited a similar trend to the lower quartile, although its values were relatively higher throughout the period. After rising and peaking at $59,648 in 2021, the figure fell to $43,707 in 2022, then turned negative in 2023 at -$13,661, and declined further to -$24,976 in 2024. The decrease in CRTDR from 2021 to 2022 is notable, given that the average accrual net farm income for all farms increased from 2021 to 2022. Rising interest rates on term debt, as well as differences in average net income amongst the different groups, could be two potential reasons. Even the 75th percentile (upper quartile), which maintained positive margins throughout the period, experienced significant declines in the latter years. From a high of $101,949 in 2021, the upper quartile fell to $21,365 by 2024. Even with average net farm income dropping from 2023 to 2024, the upper quartile stayed about the same.
Medium-size Grain Farms
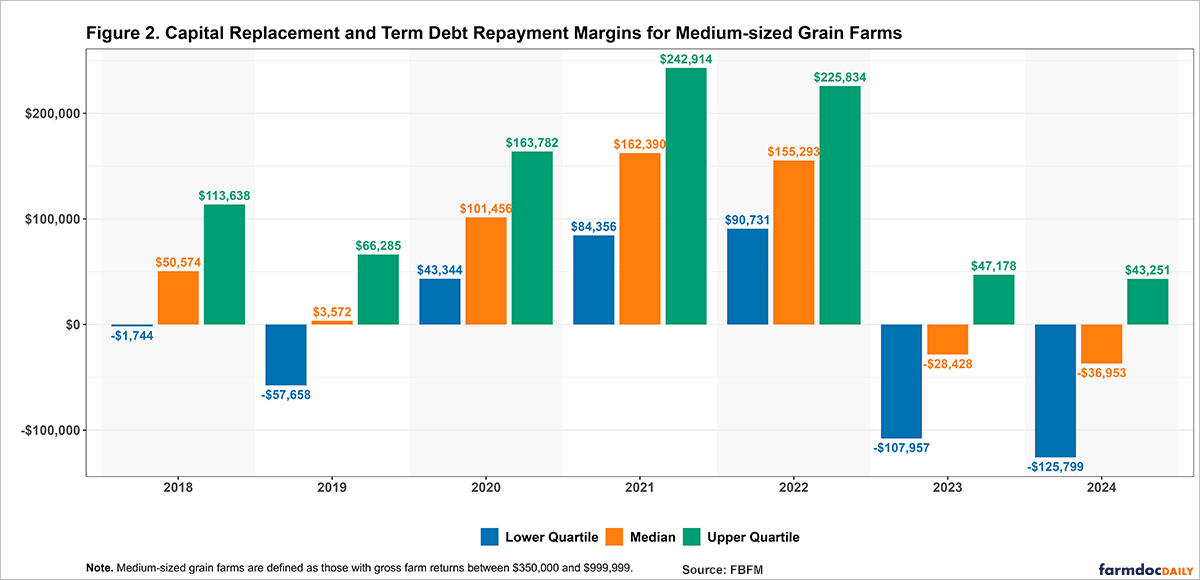
Figure 2 shows the CRTDR margin for medium-sized grain farms across the same period. Naturally, these values are greater in magnitude since these farms are larger in terms of gross farm returns. The 25th percentile (lower quartile) peaked at $90,731 in 2022 and became negative the following year, falling to -$107,957 in 2023 and further to -$125,799 in 2024, due to significantly lower incomes, as seen for the small grossing farms. Unlike the small farms and the other quartiles for medium-sized farms, the CRTDR margin increased from 2021 to 2022, as did the average net farm income. Similarly, the median margin fell from $155,293 in 2022 to a negative margin of -$28,428 in 2023 and fell further to -$36,953 in 2024. The 75th percentile (upper quartile) also dropped sharply, falling from a high of $225,834 in 2022 to $43,251 in 2024, but remained positive across the entire period. As we saw for the small farms, there was also a less significant decrease in the CRTDR margin from 2023 to 2024 for the upper quartile.
Large Grain Farms
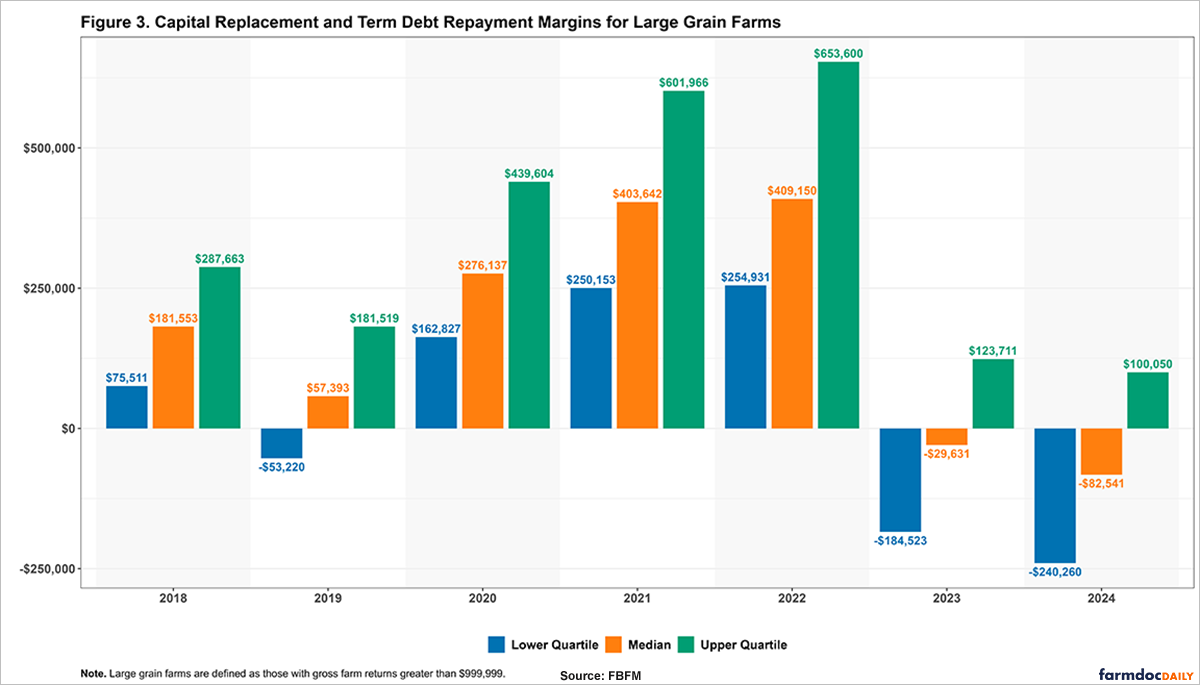
Figure 3 shows the CRTDR margin for large grain farms, which reported the highest repayment capacity levels across the board—but also the steepest absolute declines. The 25th percentile (lower quartile) fell from a positive margin of $254,931 in 2022 to -$184,523 in 2023 and -$240,260 in 2024. This represents a nearly half-million-dollar swing in just two years for the most financially constrained large farms. The drop in the CRTDR margin corresponds with the significant decrease in the average net farm income observed for all farms during this period. The median CRTDR margin, which peaked at $409,150 in 2022, declined sharply to -$82,541 in 2024. At the 75th percentile, repayment capacity remained positive across the entire period. After reaching a high of $653,600 in 2022, the margin fell to $123,711 in 2023—a decline of almost $530,000 that was greater than the lower quartile—before slipping again by a lesser amount to $100,050 the following year. Unlike the other-sized farms, all quartiles for large farms increased their respective CRTDR margin from 2021 to 2022, just as the average net farm income for all farms did.
Conclusion
The sharp decline in capital replacement and term debt repayment margins across all farm sizes—especially since 2022—indicates a broad and rapid deterioration in the repayment capacity of grain farms. This corresponds with the change in the average net farm income during this period. Another factor in this calculation is family living expenses, which have been increasing. From 2018 to 2024, the average family living expense (including contributions, medical, life insurance, expendables, and family living capital) increased by 24%, or over $20,000. Most of this increase occurred in 2021, following a 14% rise from 2020 to 2021. From 2018 to 2024, off-farm income also increased by 45%, or over $20,000, with much of this increase occurring between 2022 and 2023, rising by 16%. What is most striking is not just that the lower quartiles turned negative, but that even the median and upper quartile values fell substantially. This indicates that the decline in producers’ ability to replace capital assets and take on new term debt is widespread. The negative quartile CRTDR margins shown in this article are supported by FBFM family living studies, which have shown the average farm also has negative numbers after deducting family living and income taxes from all income (both farm and non-farm) for 2023 and 2024. The deterioration in CRTDR margins (which is negative for the lower and median quartiles for all size farms in 2023 and 2024) helps explain the decline in demand for farm machinery and equipment in recent years, as well as the decline in loan volumes issued by commercial banks.
Acknowledgment
The authors would like to acknowledge that data used in this study comes from the Illinois Farm Business Farm Management (FBFM) Association. Without Illinois FBFM, information as comprehensive and accurate as this would not be available for educational purposes. FBFM, which consists of 5,000+ farmers and 70 professional field staff, is a not-for-profit organization available to all farm operators in Illinois. FBFM field staff provide on-farm counsel along with recordkeeping, farm financial management, business entity planning and income tax management. For more information, please contact our office located on the campus of the University of Illinois in the Department of Agricultural and Consumer Economics at 217-333-8346 or visit the FBFM website at www.fbfm.org.
References
Mashange, G. "The Current State of the Farm Machinery and Equipment Market." farmdoc daily (15):197, Department of Agricultural and Consumer Economics, University of Illinois at Urbana-Champaign, October 24, 2025.
Appendices
Disclaimer: We request all readers, electronic media and others follow our citation guidelines when re-posting articles from farmdoc daily. Guidelines are available here. The farmdoc daily website falls under University of Illinois copyright and intellectual property rights. For a detailed statement, please see the University of Illinois Copyright Information and Policies here.