


Monetizing Crop Risk into Crop Payments
US federally subsidized crop insurance has monetized field crop production risk into a multi-billion dollar income flow to farmers. Monetized value has grown with higher market value of production, higher premium subsidies, higher coverage levels, and, recently, higher use of area add-up insurance. Monetization will continue as the 2025 Farm Bill and associated administrative actions have raised premium subsidies for nearly all insurance products including an 80% subsidy for 95% coverage ECO (Enhanced Coverage Option) area add-up insurance (see Data Note).
Data
Monetization metrics are calculated collectively for nine large acreage field crops eligible for crop insurance in all years from 2001 to 2024: barley, corn, cotton, grain sorghum, oats, peanuts, rice, soybeans, and wheat. This study thus postdates the Agricultural Risk Protection Act of 2000, which notably raised federal premium subsidies, and the late 1990s advent of revenue insurance. Data are from USDA, RMA (US Department of Agriculture, Risk Management Agency) Summary of Business.
Risk Monetization
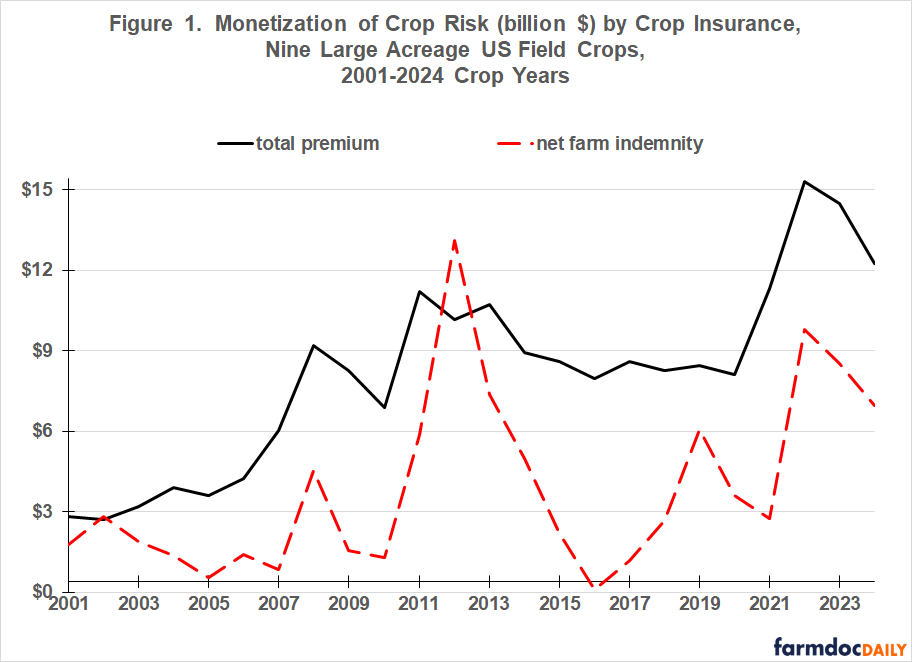
Crop insurance premiums can be thought of as the average monetary value of a crop at risk prior to planting. Liability is the value at risk if a crop is a complete failure, but none of the nine crops has ever had a complete US failure. In 2024, insurance premiums for the nine crops totaled $11.8 billion, 392% more than in 2001 (see Figure 1). Indemnities net of farmer-paid premiums resulted in a $6.5 billion income flow to farmers, 376% more than in 2001. Monetization of risk occurred far faster than the 198% increase in the market value of the nine crops.
Exploring Monetization
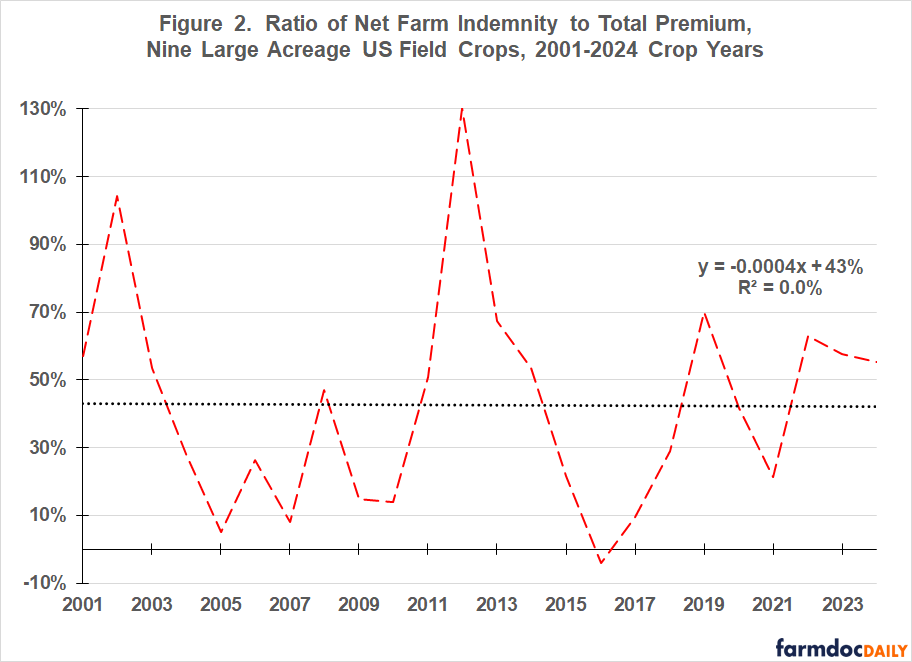
During the 21st Century, net farm indemnities as a share of total premiums for the nine crops has exhibited no trend (see Figure 2). A linear time trend has zero explanatory power (i.e., R2 = 0%). On average, farmers netted 43% of insurance premiums, but variation by year was considerable. In 2002 and 2012, net farmer indemnities exceeded total premiums, which equals subsidies plus farmer paid premiums. In 2016, farmers paid more in premiums than they received in indemnities.
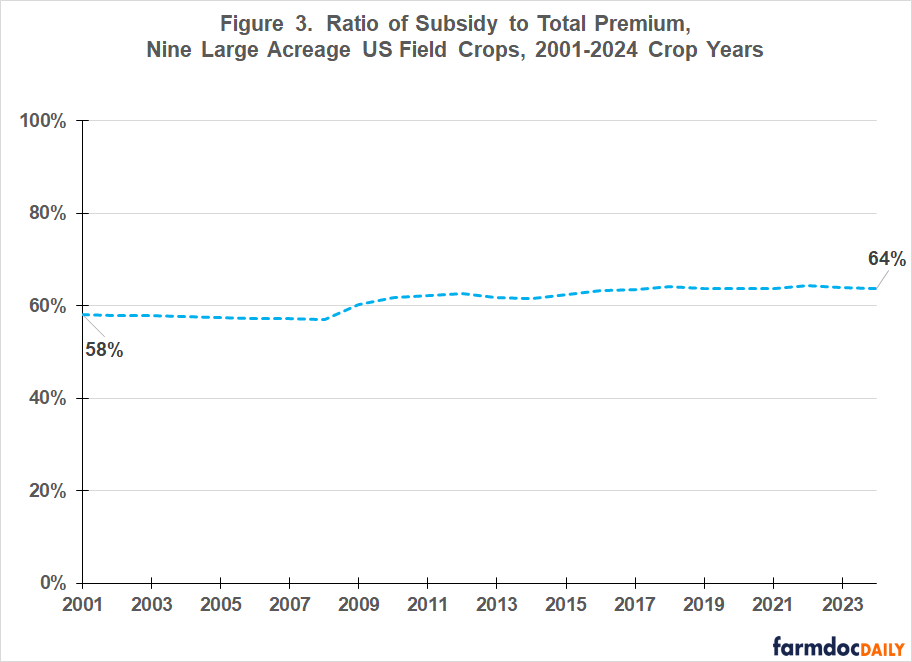
In contrast, the share of total premium covered by federal premium subsidies for the nine crops has risen (see Figure 3). In particular, between 2008 and 2011 the share rose from 57% to 62%, largely due to the 2008 Farm Bill’s authorization of enterprise insurance units. Their average subsidy rate is 75% across all individual farm insurance coverage levels. Average subsidy rate was 57% for basic and optional units during this period.
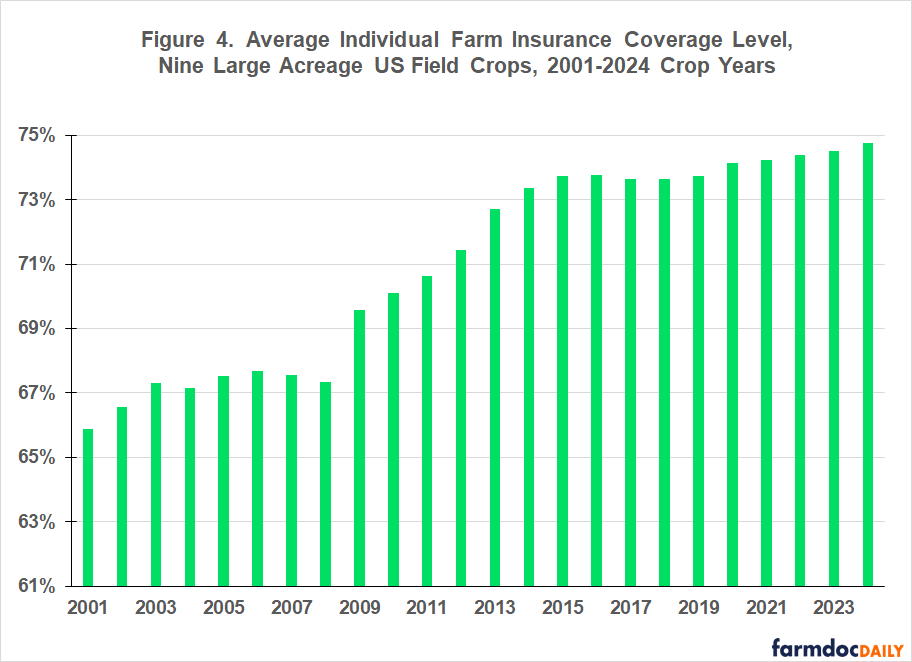
Assuming farmers make the same insurance decisions, higher premium subsidy rates should raise net farmer indemnities since they pay less of the premium. Decisions did not remain the same. Farmers increased individual farm insurance coverage levels (see Figure 4). Coverage jumped higher in 2009 and continued to rise through 2015 as use of enterprise units grew. Subsidy rates are lower at higher coverage levels, resulting in farmers paying more of the premium. In net, these two offsetting impacts resulted in net farmer indemnities remaining a constant share of total premiums (see Figure 2). Average coverage levels started increasing again in the 2020s, coinciding with area add-up insurance’s share of individual farm insurance acres increasing from 3% to 20%.
Policy Discussion
US federally subsidized crop insurance has monetized field crop production risk into a now $6 billion plus income flow to US field crop producers as a group.
This is a sector observation. Not every farmer has received more indemnities than premiums paid. Since a risk event triggers insurance payments, they are skewed to the riskiest US regions and farmers.
Monetized value has increased as market value of production increased and as premium subsidy rates were raised, incentivizing farmers to buy higher coverage levels. The recent surge in area add-up insurance has further monetized risk by expanding the share of risk covered, notably growing season downside price risk (see farmdoc daily of July 21, 2025). It also appears that buying area add-up insurance encourages buying higher individual farm insurance coverage.
Monetization of risk will continue. The 2025 Farm Bill and associated administrative decisions raised premium subsidies for nearly all insurance products, including an 80% subsidy for 95% coverage ECO (Enhanced Coverage Option) area add-up insurance.
No reason exists to expect risk monetization to stop with the 2025 Farm Bill, but good policy requires asking, “What are the impacts of risk monetization and is it hurting, neutral, or helping the US field crop production sector and US society in general?”
Data Note
The 2025 One Big Beautiful Bill raised SCO subsidy rate to 80%. USDA, RMA administrative action dated August 20, 2025 raised ECO subsidy rate to 80%.
References
US Congress (119th). Accessed November 2025. H.R. 1 – One Big Beautiful Bill. CONGRESS.GOV https://www.congress.gov/bill/119th-congress/house-bill/1.
US Department of Agriculture, Risk Management Agency. November 2025. Summary of Business. http://www.rma.usda.gov
US Department of Agriculture, Risk Management Agency. August 20, 2025. MGR-25-006: One Big Beautiful Bill Act Amendment. https://www.rma.usda.gov/policy-procedure/bulletins-memos/managers-bulletin/mgr-25-006-one-big-beautiful-bill-act-amendment
US Department of Agriculture, Risk Management Agency. Revised January 2024. Stacked Income Protection Plan (STAX) for Upland Cotton. Fact Sheet. https://www.rma.usda.gov/sites/default/files/2024-02/STAX-Upland-Cotton-Fact-Sheet.pdf
Zulauf, C. "Crop Insurance, 2025 Farm Bill, and Mission Creep." farmdoc daily (15):132, Department of Agricultural and Consumer Economics, University of Illinois at Urbana-Champaign, July 21, 2025.
Disclaimer: We request all readers, electronic media and others follow our citation guidelines when re-posting articles from farmdoc daily. Guidelines are available here. The farmdoc daily website falls under University of Illinois copyright and intellectual property rights. For a detailed statement, please see the University of Illinois Copyright Information and Policies here.