


Use of Funds Remains Relatively High on Illinois Farms
Incomes on Illinois grain farms in 2024 were lower than in any other year since the early 1990s (see farmdoc daily, December 2, 2025). In this article, we compare three primary uses of funds to the sum of farm and non-farm income. Two major uses of income – machinery and building purchases and family living withdrawals – have exceeded historical levels relative to farm income. Non-farm income remains an important source of stability for many Illinois farms, buffering the large swings in farm income.
Incomes and Uses of Funds
We summarize the sources and uses of funds for all farms enrolled in Illinois Farm Business Farm Management (FBFM) that track sources and uses of funds, including family living expenditures. Not all farms enrolled in FBFM track sources and uses. Moreover, farms must be sole proprietors to be included in this summary. Still, in recent years, over 1,300 farms have tracked sources and uses and been certified as complete and accurate by FBFM field staff. Use of this data enables consistent tracking of income with fund use. In 2024, the average age of farmers included in the analysis is 58 years. Age has trended up over time. The average number of family members is 2.5, which has trended down over time.
We state all sources and uses on an operator acre basis. An operator acre represents the number of acres from which a farm receives revenue. Owned and cash rented acres count as full operator acres. One acre that is share-rented, with the farmer receiving 50% of the revenue, counts as 0.5 operator acres. There was an average of 883 operator acres in 2024.
Sources of Funds
Significant sources of funds on most farms are net farm income and non-farm income (see Figure 1). Over time, average non-farm income has increased from $18 per operator acre in 1993 up to $73 per acre in 2024.
As one would expect, there has been a great deal of variability in net farm income on a per operator acre basis. That variability follows the usual patterns (farmdoc daily, December 2, 2025). From 1993 to 2004, net farm income averaged $77 per operator acre. During the ethanol build, net farm income increased, reaching a high of $356 per acre in 2012. Farm income then fell, averaging $80 per operator acre from 2015 to 2019. Income then increased for a variety of factors, including short supplies of crops in major producing areas, ad hoc payments associated with COVID, and supply disruptions caused by the Ukraine-Russia war. Income hit a high of $451 per operator acre in 2022 Since 2022, net income has declined, reaching a low of $9 per operator acre in 2024.
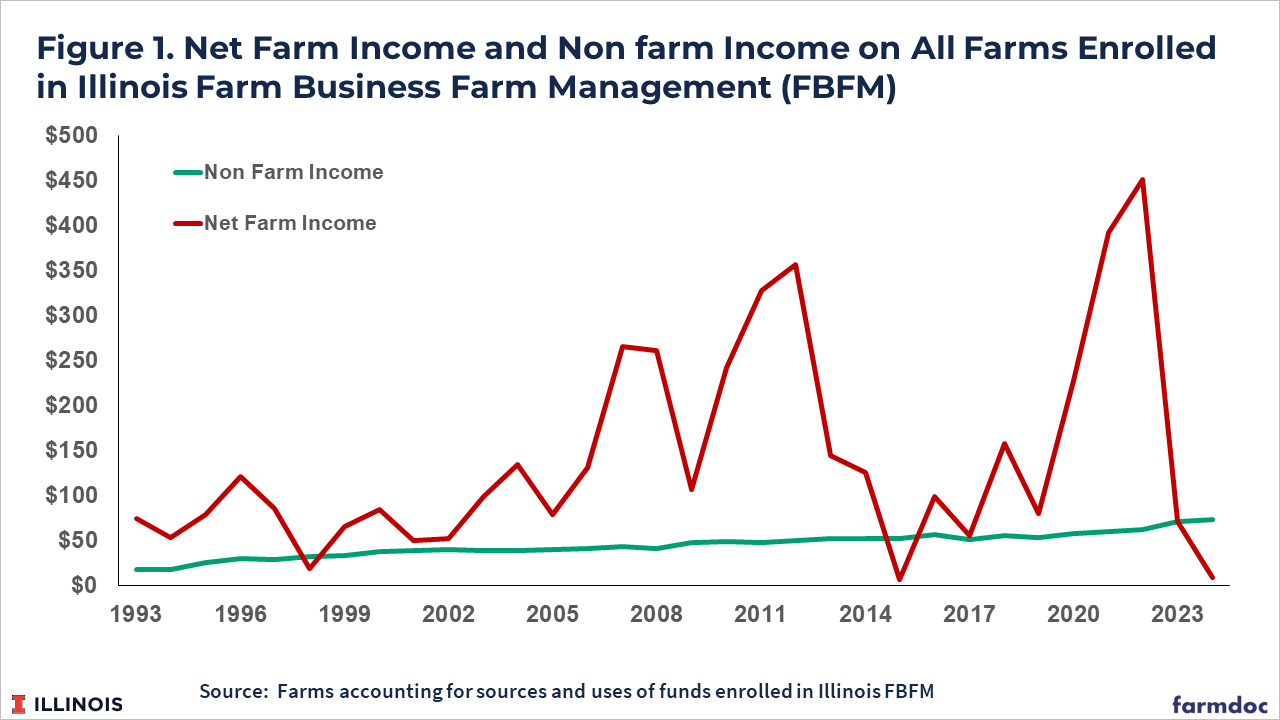
Overall, average non-farm income per operator acre has been relatively stable across farms. Net farm income has been much more variable, driving much of the variability in total sources of funds averaged across all farms.
Uses of Funds
Selected use of funds is shown in Figure 2 on a per operator acre basis. Figure 2 also shows a dotted line that represents the sum of net farm income and non-farm income, combining the two series in Figure 1. The sum follows changes in net farm income, but is significantly higher because of the inclusion of non-farm income. On average, non-farm income acts as a large buffer for many farms in Illinois.
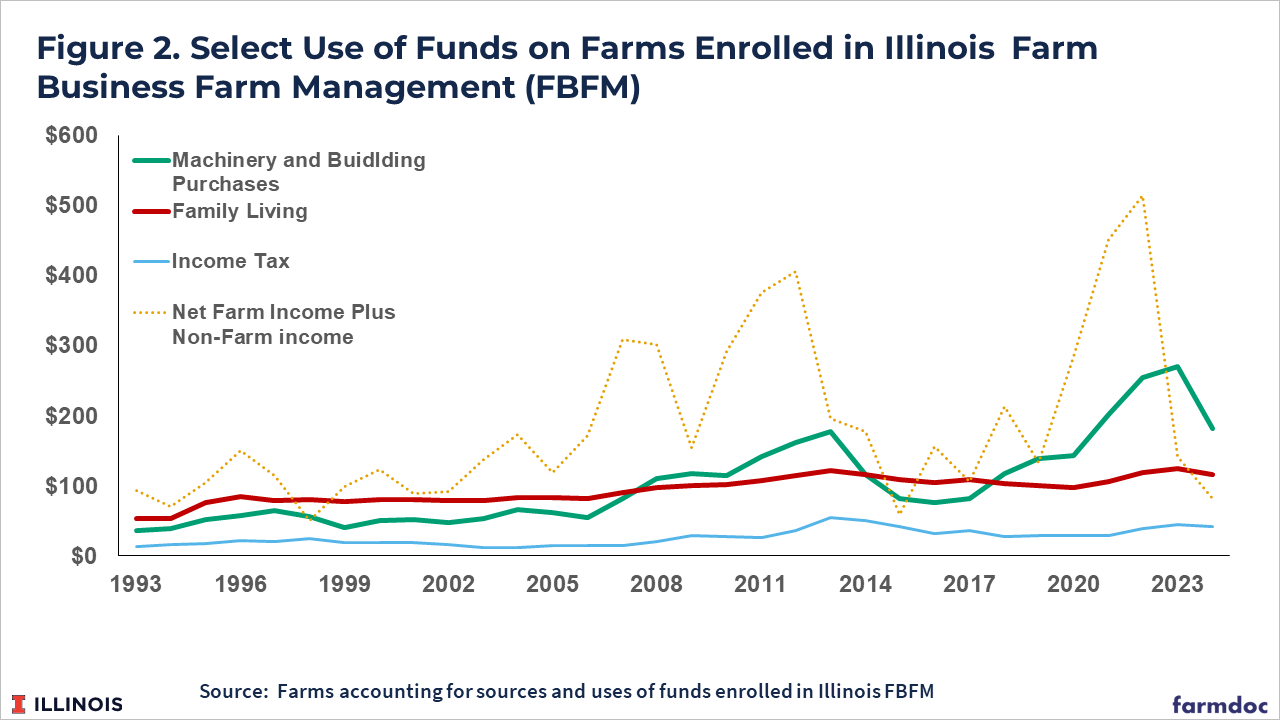
Figure 2 reports three uses:
- Machinery and building purchases. Machinery and building purchases have been variable over the past 30 years, typically lagging changes in incomes. For example, the sum of farm and non-farm reached a high of $524 per operator acre in 2022, before falling to $142 in 2023 and $82 in 2024. Machinery and building purchases reached a high of $255 per acre one year later, then fell to $182 in 2024. Over the last two years, machinery and building purchases have exceeded the combined farm and non-farm income. This has happened in three other years: 1998, with machinery purchases $5 higher than farm and non-farm income; 2015, with $24 higher machinery and building purchases; and 2019, with $5 higher machinery and building purchases (see Figure 2). The magnitude of those deficits is much larger in 2023 ($128) and 2024 ($100).
- Family living has been on a general increasing trend over time, beginning at $54 per operator acre in 1993 and increasing to $125 per acre in 2023. There is variability in family living expenditures. In recent years, family living increased from $97 in 2020 to $125 in 2023, then fell to $116 in 2024. Overall, there is a positive correlation with income, with a .48 correlation coefficient between family living and total income (sum of farm and non-farm incomes). The variability in family living is much less than the variability in total income (see farmdoc daily, November 21, 2025 for more detail).
- Income tax has increased over time from $14 per operator acre in 1993 up to the $40 range in the last several years. Note that income tax will be paid on both farm and non-farm income, so the value is not due only to farm income. While there is variability, that variability is not highly correlated with income. Part of this is due to strategies to maximize after-tax income. One common strategy is to use the expense election or bonus depreciation on eligible capital purchases to reduce taxes in the current year. Also changes in tax policy, such as the recent Tax Cuts and Jobs Act of 2018 and the One Big Beautiful Bill Act in 2025, lowered tax rates and added additional or extended existing deductions.
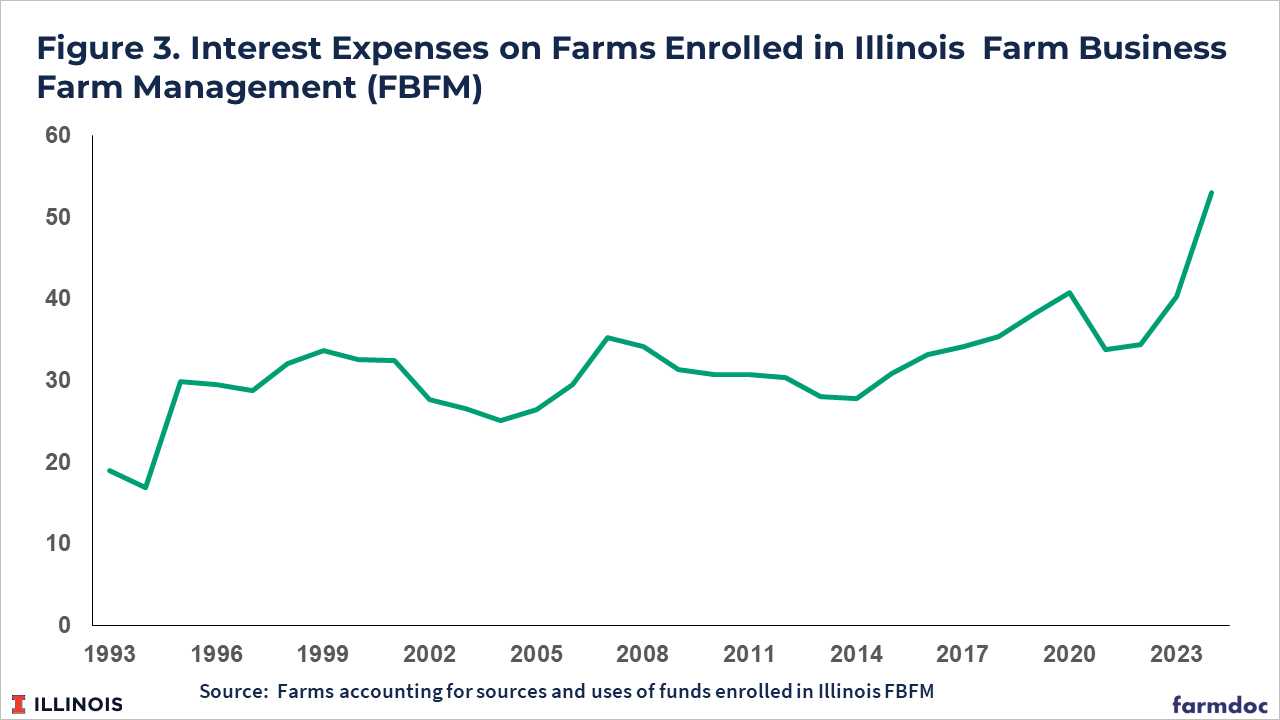
The high levels of use of funds in recent years have resulted in the need for funds from other sources, with some of those funds provided by debt capital. Higher debt capital use, along with higher interest rates, has increased interest expenses on farms in recent years. Interest expenses have increased from $34 per operator acre in 2021 to $53 per operator acre in 2024, the highest interest expense level since data became available in 1993 (see Figure 3). From 2021 to 2024, liability levels increased 16%, while interest costs increased by 55%.
Commentary
Machinery and buildings have exhibited variability across time, which tends to lag changes in incomes. This lag happens because farmers pay the majority of their tax liability the year after harvest, but that tax liability is typically based mostly on income from the prior year’s crop and prepaid for the upcoming crop year. In 2023 and 2024, machinery and building expenditures exceeded the sum of farm and non-farm incomes by large margins, suggesting further declines in machinery and building purchases in the near term.
Non-farm income is an important source of funding on Illinois grain farms. Without that source of income, the cash flow situation would be much worse on many farms in Illinois. This is the one income source that has consistently increased over this time period.
The values in this article represent averages, which mask variability across farms. For example, changes in non-farm incomes are fairly muted in the averages. On an individual farm, swings in non-farm income could be large, as changes in employment could affect non-farm income in both positive and negative ways.
References
Schnitkey, G., N. Paulson, B. Zwilling and C. Zulauf. "The Current Grain Farm Financial Position in a Longer-Term Perspective." farmdoc daily (15):221, Department of Agricultural and Consumer Economics, University of Illinois at Urbana-Champaign, December 2, 2025.
Schnitkey, G., N. Paulson, C. Zulauf and B. Zwilling. "Large Increase in Machinery Costs Suggests Need to Reconsider Machinery Purchase Decisions." farmdoc daily (15):189, Department of Agricultural and Consumer Economics, University of Illinois at Urbana-Champaign, October 14, 2025.
Zulauf, C., G. Schnitkey and N. Paulson. "Individual US Crop Inputs Post 2014 Farm Bill." farmdoc daily (15):198, Department of Agricultural and Consumer Economics, University of Illinois at Urbana-Champaign, October 28, 2025.
Zwilling, B. "When Creating 2026 Crop Budgets, Keep in Mind Family Living Costs." farmdoc daily (15):216, Department of Agricultural and Consumer Economics, University of Illinois at Urbana-Champaign, November 21, 2025.
Disclaimer: We request all readers, electronic media and others follow our citation guidelines when re-posting articles from farmdoc daily. Guidelines are available here. The farmdoc daily website falls under University of Illinois copyright and intellectual property rights. For a detailed statement, please see the University of Illinois Copyright Information and Policies here.