


Tenure Characteristics of Illinois Farmland
Data from the Illinois Farm Business Farm Management (FBFM) Association provides insight into farmland tenure and leasing arrangements across Illinois. The data summarized in Tables 1 and 2 are drawn from Illinois grain farms enrolled in FBFM. These farms receive the majority of their income from grain production and operate at least 500 acres. While the dataset is representative of commercial grain farms in Illinois, it is important to note that it is not a statistical sample of all commercial grain farms in the state.
Statewide Tenure Patterns
Table 1 summarizes land control arrangements for FBFM grain farms from 2020 through 2024, including regional detail for northern, central (high SPR), and southern Illinois. In 2024, Illinois FBFM operators owned 24 percent of the land they farmed, crop shared 26 percent, and cash rented 50 percent of their operated acres. Under crop share arrangements, operators and landowners share both revenue and selected production expenses. In contrast, cash rent arrangements require the operator to pay a fixed or variable cash payment to the landowner while retaining all production risk and reward. Variable cash rent leases are classified as cash rent in this analysis.
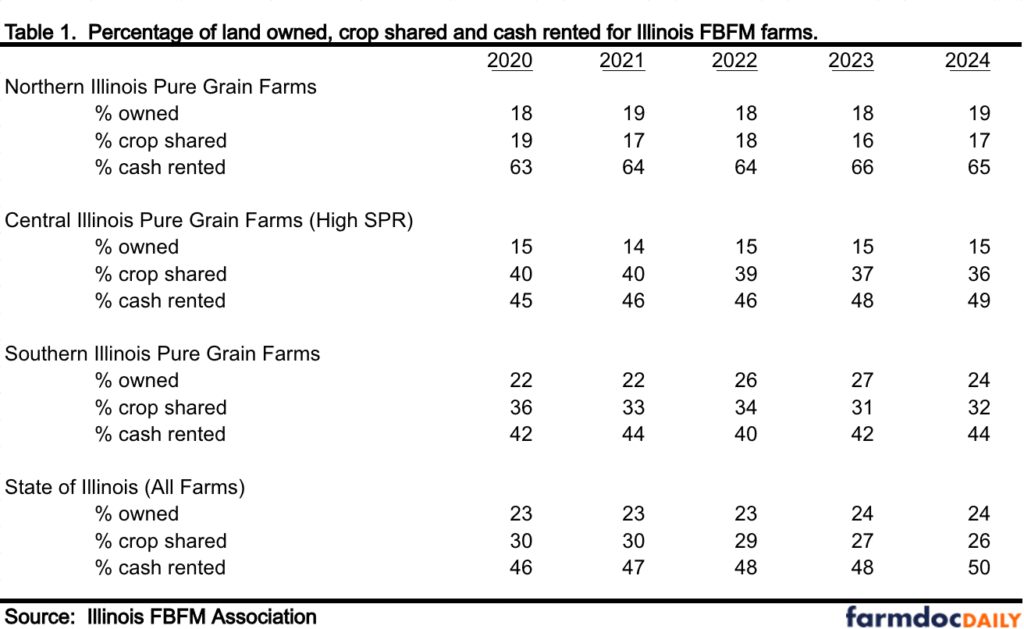
Over time, Illinois has experienced a gradual but consistent shift away from crop share leases toward cash rent arrangements. Statewide, crop-shared acres on the average farm declined from 30 percent in 2020 to 26 percent in 2024, while cash-rented acres increased from 46 percent to 50 percent over the same period as shown in Table 1. Although cash rent now accounts for a larger share of operated acres on the average farm, crop share leases remain an important component of farmland tenure. The most recent year in which crop-shared acres exceeded cash-rented acres was 2006; since then, cash rent has consistently represented the dominant lease type on the average farm.
Regional Differences in Leasing Arrangements
Leasing arrangements vary substantially by geographic region within Illinois, reflecting differences in soil productivity, farm size, crop rotations, and long-standing regional practices. As shown in Table 1, northern Illinois farms in 2024 cash rented 65 percent of their operated land, crop shared 17 percent and owned 19 percent. In contrast, central Illinois farms with high soil productivity ratings cash rented 49 percent of their acres, crop shared 36 percent – the highest share of crop share leasing in the state – and owned 15 percent. Southern Illinois farms averaged 44 percent cash-rented acres, 32 percent crop-shared acres, and 24 percent owned acres in 2024.
Ownership patterns also differed by region. Southern Illinois operators owned 24 percent of the land they farmed, compared to 15 percent in central Illinois and 19 percent in northern Illinois Despite ongoing farm expansion and continued purchases of farmland by farm operators, the proportion of owned land relative to total acres farmed has remained relatively stable at the average from 2020 through 2024. Statewide, operator-owned land accounted for 24 percent of total operated acres in 2024.
Tenure and Economic Profitability
Table 2, examines land tenure patterns by economic profitability, comparing the 10-year average land control arrangements for farms in the high third and low third of management returns across northern, central and southern Illinois. Economic profitability is measured using accrual net income, with a charge applied for unpaid labor and opportunity interest charges used for both land and non-land capital rather than actual interest paid.
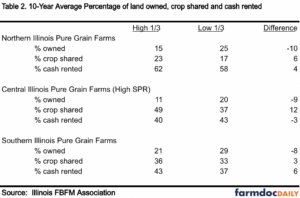
Across all regions, farms in the high third of management returns owned a smaller percentage of their operated land and crop shared a larger share of acres compared to farms in the low third, as shown by the 10-year averages in Table 2. For example, in central Illinois with the high productivity ratings and where crop share leasing is most common, high-third farms owned 9 percentage points less land (11 percent vs 20 percent), crop shared 12 percentage points more land (49 percent versus 37 percent), and cash rented 3 percentage points less land (40 percent versus 43 percent) than low-third farms. Central Illinois differed from northern and southern Illinois in that high-third farms cash rented a smaller share of acres than low- third farms, reflecting the greater prevalence of crop share leasing in that region.
Summary
Overall, farmland tenure in Illinois varies systematically from north to south, with northern Illinois characterized by a higher reliance on cash rent, central Illinois by greater use of crop share leases, and southern Illinois by a higher proportion of owned land. The profitability analysis in Table 2 further shows that average higher-return operations consistently control land in ways the reduce fixed ownership exposure and increase risk sharing through crop share arrangements. These patterns reflect differences in productivity, risk-sharing preferences, and regional leasing norms.
When examining economic performance, farms in the top third of economic profitability generally rely less on land ownership and more on crop share arrangements than lower-performing farms. While each operation is unique, understanding the true economic returns associated with owning, cash renting, or crop sharing land is critical for making farm financial management decisions. Consistent recordkeeping and periodic analysis of tenure trends can help producers better evaluate the financial implications of adding or adjusting different type of land control within your operation.
The author would like to acknowledge that data used in this study comes from Illinois Farm Business Farm Management (FBFM) Association. Without their cooperation, information as comprehensive and accurate as this would not be available for educational purposes. FBFM, which consists of 5,000 plus farmers and 70 plus professional field staff, is a not-for-profit organization available to all farm operators in Illinois. FBFM field staff provide on-farm counsel with computerized recordkeeping, farm financial management, business entity planning and income tax management. For more information, please contact the State FBFM Office located at the University of Illinois Department of Agricultural and Consumer Economics at 217-333-8346 or visit the FBFM website at www.fbfm.org.
Disclaimer: We request all readers, electronic media and others follow our citation guidelines when re-posting articles from farmdoc daily. Guidelines are available here. The farmdoc daily website falls under University of Illinois copyright and intellectual property rights. For a detailed statement, please see the University of Illinois Copyright Information and Policies here.