


2014 Farm Bill: the Big Picture As Seen Through Spending
Overview
This post takes a broad view of the 2014 farm bill and more specifically the farm safety net as seen through the lens of projected spending levels. In essence, the post examines the who-won/who-lost question and what it tells us about the state of the farm bill debate in the U.S. Primary sources of information are the (1) U.S. Congress, Congressional Budget Office (CBO) January 28, 2014 letter to the Honorable Frank D. Lucas, Chair, House of Representatives Committee on Agriculture, available here; and (2) Agricultural Act of 2014, available here.
Summary Observations
- The field crop safety net (including crop support under the commodities and crop insurance titles) retains nearly 80% of the savings from eliminating direct payments as projected spending increases for the other field crop safety net programs: price programs, revenue programs, and insurance. Thus, the farm safety net continues its historical focus on field crops.
- Over 80% of the projected increase in spending on insurance was for the new county insurance products. However, the farm bill also enhances current insurance products, creates new insurance products, and increases premium reductions for beginning and new farm operators.
- Some of the savings from eliminating direct payments funds a new dairy risk assistance program and a now permanent disaster assistance program, primarily for livestock. Thus, the livestock sector is a winner at the expense of the field crop sector.
- The previous observation, combined with increased spending on the horticulture title, is consistent with a farm bill policy trend that dates to the 2002 farm bill: the growing inclusiveness of farm products in the farm bill and more specifically the farm safety net.
- Spending is shifted from the titles that historically account for the largest share of farm bill spending (commodities, nutrition, and conservation titles) to the other titles, including trade, credit, rural development, research and extension, forestry, energy, and miscellaneous. While spending remains comparatively very small on these titles, the marginal shift in spending to them likely reflects the need to extend the scope of the farm bill so as to secure its passage.
- In short, the 2014 farm bill is more inclusive in its farm and nonfarm scope and less inequitable in spending across farm products, features key to its legislative success.
Titles, Agricultural Act of 2014 (2014 farm bill)
[table-wrap bordered=”true” striped=”true”]| Title I | Commodities | Title II | Conservation |
| Title III | Trade | Title IV | Nutrition |
| Title V | Credit | Title VI | Rural Development |
| Title VII | Research, Extension, Related Matters | Title VIII | Forestry |
| Title IX | Energy | Title X | Horticulture |
| Title XI | Crop Insurance | Title XII | Miscellaneous |
Spending (Direct Outlays) over Fiscal Years (FY) 2014-2023 – Figure 1
- CBO projects spending by the 2014 farm bill to total $956.40 billion over the 10 fiscal years.
- As noted widely, Title IV (Nutrition) dominates projected farm bill spending at a 79.1% share.
- Second largest share of projected spending (9.4%) is for Title XI (Crop Insurance).
- Third largest share of projected spending (6.0%) is for Title II (Conservation).
- The title most associated with farm bills, Title I (Commodities), is 4.6% of projected spending.
- The farm safety net (Titles I plus XI) accounts for 14% (9.4% + 4.6%) of projected spending.
- The other 8 titles account for only 0.8% of projected spending, with Trade (Title III) the largest.
- Credit (Title V) is a source of revenue for the government, primarily because it is able to borrow money at somewhat cheaper rates than it lends for farm bill credit programs. This revenue can, in part, be seen as a way to cover the administrative costs of farm bill credit programs.

Estimated Changes in Spending over FY 2014-2023 – Figure 2
- CBO projects the 2014 farm bill will spend -$16.50 billion less over the 10 fiscal years than an extension of existing programs, the so-called baseline spending.
- Projected spending declines for Title I (Commodities) but increases for Title XI (Crop Insurance), resulting in a -$8.59 billion decline in spending on the farm safety net.
- Projected spending declines almost as much for Title IV (Nutrition) as the farm safety net: -$8.00 billion vs. -$8.59 billion. Projected spending also declines for Title II (Conservation) by -$3.97 billion. For more detail on spending on Title II, see the May 14, 2014 farmdoc daily article, “2014 Farm Bill Conservation (Title II) Programs“.
- The projected spending declines in the previous bullet as a share of projected spending on the area are -6.9% for Conservation, -6.4% for the farm safety net, and -1.1% for Nutrition.
- Excluding Title V (Credit), projected spending increases for the other titles, with the largest increase being for Title VII (Research, Extension, and Related Matters).

Spending Changes in Title I (Commodities) over FY 2014-2023 – Figure 3
- The largest single source of savings in the 2014 farm bill is the elimination of direct payments, with projected savings of -$40.85 billion over FY 2014-2023.
- Since the projected spending on Title I declines by only -$14.31 billion, 65% ($26.54 billion / $40.85 billion) of the savings from eliminating direct payments remain in Title 1.
- Projected spending on price programs increases $11.84 billion, primarily because price support levels in the Price Loss Coverage (PLC) program are higher than in the Price Countercyclical (PC) program it replaces.
- Projected spending on the revenue program increases $9.39 billion, primarily because participation is projected to be higher in the Agriculture Risk Coverage (ARC) program than in the Average Crop Revenue Election (ACRE) program it replaces.
- Projected spending is $3.67 billion on a permanent Supplemental Disaster Assistance Program. It contains the (1) Livestock Indemnity Program for livestock losses from adverse weather or attacks by federally reintroduced animals; (2) Livestock Forage Program for losses from drought or fire; (3) emergency relief for producers of livestock, honey bees, and farm raised fish not covered by the two previous programs; and (4) Tree Assistance Program for natural disasters.
- Projected spending on the dairy safety net is $0.91 billion higher as a Dairy Production Margin Protection Program based on the difference between the price of milk and feed cost of producing milk replaces the Dairy Product Support and Milk Income Loss Contract programs.

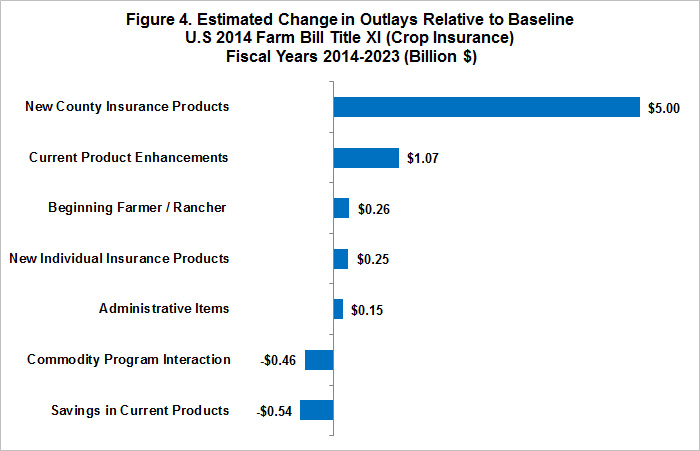
Spending Changes in Title XI (Crop Insurance) over FY 2014-2023 – Figure 4
- Projected spending on the new county insurance products for crop production yield and revenue risk is $5.00 billion. These products are the Supplemental Coverage Option (SCO) for all crops except cotton, which has a slightly different Stacked Income Protection Plan (STAX). Both provide farms the option to buy subsidized county insurance to cover part of the deductible of their individual yield and revenue product (STAX is also available as a stand-alone product).
- Projected spending on enhancements for current insurance products is $1.06 billion. They include (1) a new option for determining the minimum Actual Producer History (APH) insurance yield, (2) separate insurance contracts, including enterprise insurance, for dryland and irrigated land, and (3) new price elections for insurance for organic crops.
- Projected spending on new individual insurance products is $0.25 billion. They include revenue insurance for peanuts, weather index insurance, and margin insurance with rice the initial crop. Studies are authorized for a wide variety of new products, including insurance for catastrophic disease in swine and poultry, business interruption in poultry production; and food safety.
- Projected cost to reduce insurance for new and beginning farmers and ranchers is $0.26 billion.
- Projected savings from changes to existing products are $0.54 billion. They include changes to catastrophic insurance premiums and limits on crop production on native sod in selected states.
- Interactions between Title I (Commodities) programs and Title XI (Crop Insurance) programs are projected to reduce demand for insurance, thus generating savings of -$0.46 billion.
This publication is also available at http://aede.osu.edu/publications.
References
Congressional Budget Office. "H.R. 2642, Agricultural Act of 2014." Released January 28, 2014, accessed May 22, 2014. https://www.cbo.gov/publication/45049
U.S. 113th Congress. H. R. 2642. Accessed May 22, 2014. http://www.gpo.gov/fdsys/pkg/BILLS-113hr2642enr/pdf/BILLS-113hr2642enr.pdf
Zulauf, C. "2014 Farm Bill Conservation (Title II) Programs." farmdoc daily (4):89, Department of Agricultural and Consumer Economics, University of Illinois at Urbana-Champaign, May 14, 2014.
Disclaimer: We request all readers, electronic media and others follow our citation guidelines when re-posting articles from farmdoc daily. Guidelines are available here. The farmdoc daily website falls under University of Illinois copyright and intellectual property rights. For a detailed statement, please see the University of Illinois Copyright Information and Policies here.