Real Deflated Prices of Corn, Soybeans, Wheat, and Upland Cotton: Reemergence of the Historical Downward Trend?
A feature of US crop prices since the early 20th Century has been a declining inflation-adjusted, real value (see farmdoc daily, June 4, 2015). This article examines this historical trend in light of the price run that began in 2006. While a definitive conclusion cannot be reached, the evidence examined herein suggest the historical trend is reasserting itself. Implications for farm management and farm policy are drawn should the reasserting trend continue into the future.
Data and Procedures
The last 50 years of corn, soybean, wheat, and upland cotton prices are examined. These are the 4 largest acreage field crops in the US. The prices are from the QuickStats website of the US Department of Agriculture, National Agricultural Statistical Service. The 2016 crop year prices are the midpoint of the price range in the September 12, 2016 World Agricultural Supply and Demand Estimates (WASDE). The crop year prices are divided, i.e. deflated, by the gross domestic product implicit price deflator (GDP deflator) for the same calendar year. The GDP deflator is usually considered the most accurate measure of general inflation in an economy. Source for this data is the FRED Economic Data website of the Federal Reserve Bank of St. Louis. The GDP deflator used for 2016 is for the first half of the 2016 calendar year.
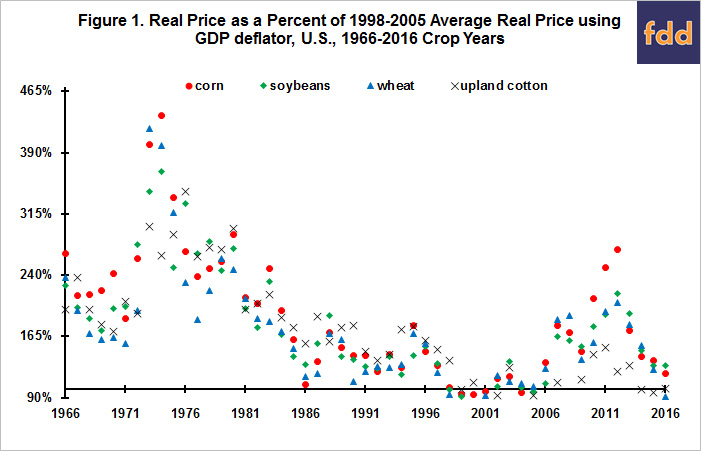
Declining Real Prices: To facilitate discussion, real prices of the four crops are expressed as a percent of their average for 1998-2005, the period of lowest real prices (see Figure 1). Real prices in 1998-2005 averaged around 50% below their average for 1966-1972, the period preceding the price run up of the 1970s. Expressed on an annual basis, between 1966-1972 and 1998-2005 real prices declined 1.3% (wheat) to 1.7% (corn) per year. Real prices at the peak of the price run up after 2006 had approximately returned to the average real prices for 1966-1972.

1970 vs 2000 Price Run Ups
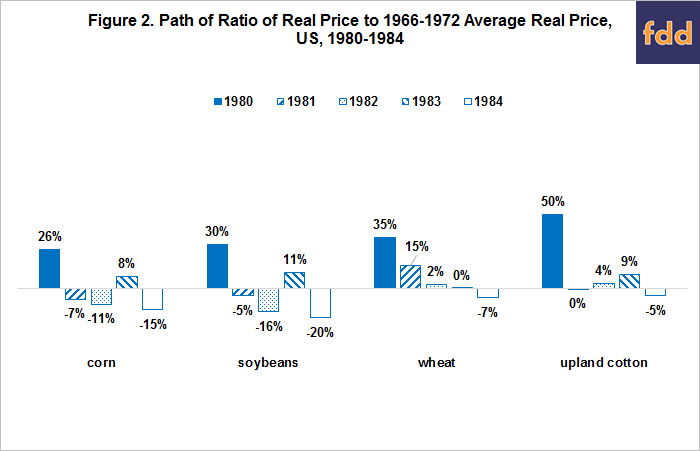
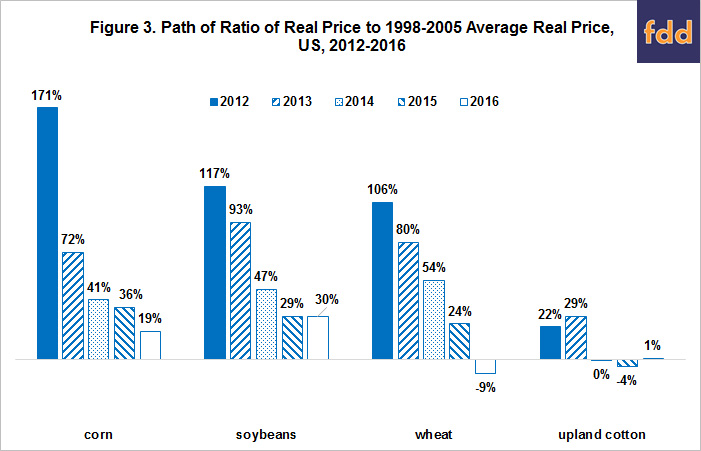
The path of real prices differed notably during the 1970 and 2000 price run ups (see Figure 1). Relative to the averages for the 1966-1972 and 1998-2005 periods that pre-date each run up, the increase in real price of corn, soybeans, and wheat by the end of the 1970 run up in 1980 was at least one third smaller than the increase by the end of the 2000 run up in 2012 (see Figures 2 and 3). Moreover, by 1981 real price of all four crops differed little from their average real price for 1966-1972. One of the key reasons for the different paths was the difference in general price inflation. The GDP deflator was 78% higher in 1980 than 1972, but only 14% higher in 2012 than 2005.


Post 2012 Period
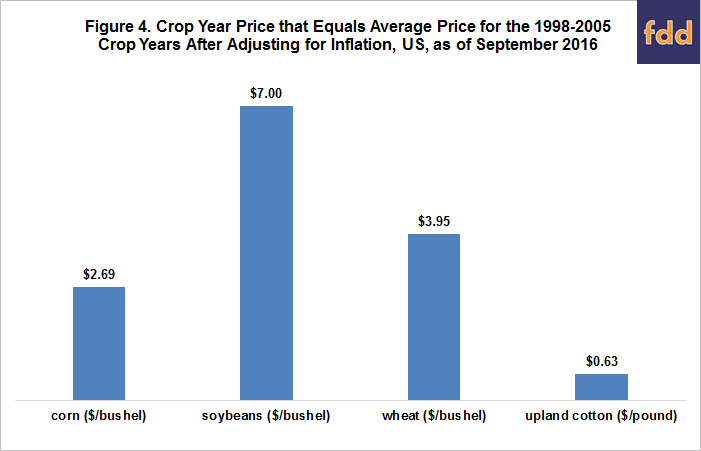
Since 2012, the real prices of corn, soybeans, wheat, and upland cotton have all declined markedly toward their average 1998-2005 real price. In fact, the real price of the midpoint forecast for 2016 wheat and upland cotton is near or below the real 1998-2005 price level. The decline in real prices since 2012 mostly reflects lower current dollar prices since US inflation remains low. The GDP deflator is only 5% higher in 2016 than 2012. As a point of reference, the 2016 crop year price that would result in a real price in 2016 equal to the 1998-2005 average real price is $2.69/bushel (bu.) for corn, $7.00/bu. for soybeans, $3.95/bu. for wheat, and $0.63/pound for upland cotton (see Figure 4). The respective midpoint forecasts in the September WASDE are $3.20, $9.05, $3.60, and $0.63.

Summary Observations
- This article presents a technical price analysis, not a fundamental economic analysis of supply and demand. Past behavior of price, specifically real price, is examined in an attempt to gain insight into potential future price behavior.
- It is important to underscore that continuation of declining real crop prices in the future is not a given. Historical trends do not always continue into the future. Demand could grow faster than supply. Moreover, an increase in inflation could increase current dollar crop prices even as real crop prices decline.
- Nevertheless, it is important to be aware of historical trends, especially those with a long track record. If a rationale does not emerge for why the historical trend will no longer apply, a reasonable guess is that it will reassert itself.
- Declines in real corn, soybean, wheat, and upland cotton prices since 2012 suggest the historical trend of lower real crop prices is reasserting itself. Wheat and upland cotton prices have already reached their real price level in 1998-2005.
- In an environment of declining real prices, focusing management on reducing per unit cost of production and conserving cash maximizes tomorrow’s chance to farm.
- The 2014 farm bill increased target prices, now called reference prices. The increase varied by crop, ranging from 8% for peanuts to 88% for barley, with the increase in general being in the 35% to 50% range. The effective increase is even larger (generally in the 50% to 75% range) since countercyclical payments in the 2008 farm bill were triggered when market price was below the crop’s target price minus its direct payment rate. The direct payment program no longer exists. Increases in reference price payment levels in an environment of decreasing real crop prices potentially translates into higher, perhaps much higher, expenditures for the Agricultural Risk Coverage and Price Loss Coverage programs. Should this scenario come to pass, it would resemble what transpired in the 1981 farm bill when Congress also markedly raised target prices. It then reversed these increases in the 1985 farm bill to gain control over increasing government expenditures. The decline in real crop prices since 2012 to levels approaching real prices in 1998-2005 suggest this policy scenario cannot be dismissed as a possibility.
References
Federal Reserve Bank of St. Louis, FRED Economic Data. Accessed October 5, 2016. https://fred.stlouisfed.org/
US Department of Agriculture, National Agricultural Statistics Service. QuickStats. Accessed October 5, 2016. http://quickstats.nass.usda.gov/
US Department of Agriculture, Office of the Chief Economist. World Agricultural Supply and Demand Estimates. September 12, 2016. WASDE 557. http://www.usda.gov/oce/commodity/wasde/index.htm
Zulauf, C. "Current Corn, Soybean, and Wheat Prices in Long Term Perspective" farmdoc daily (5):103, Department of Agricultural, Environmental and Development Economics, The Ohio State University, June 4, 2015.
Disclaimer: We request all readers, electronic media and others follow our citation guidelines when re-posting articles from farmdoc daily. Guidelines are available here. The farmdoc daily website falls under University of Illinois copyright and intellectual property rights. For a detailed statement, please see the University of Illinois Copyright Information and Policies here.


