


2019 and 2015 through 2019 – Characteristics of Higher Profit Farms
Data from the Illinois Farm Business Farm Management Association (FBFM) for 2015 through 2019 was used to analyze selected differences between the highest profit grain farms (high one-third) and the lower profit grain farms (low one-third). The analysis was done for 2019 and for the 2015 through 2019 five-year average. Farms in the higher profit group were larger, had higher corn and soybean yields, and had higher gross returns and lower costs. Management returns, a profit measurement, was significantly greater for the higher profit farms.
Farms are grouped by region in the state – north, central and south. The central region is also divided into a group of higher productive soils and a group with less productive soils. All farms were at least 500 acres in size with no or very limited livestock enterprises.
Crop Yields
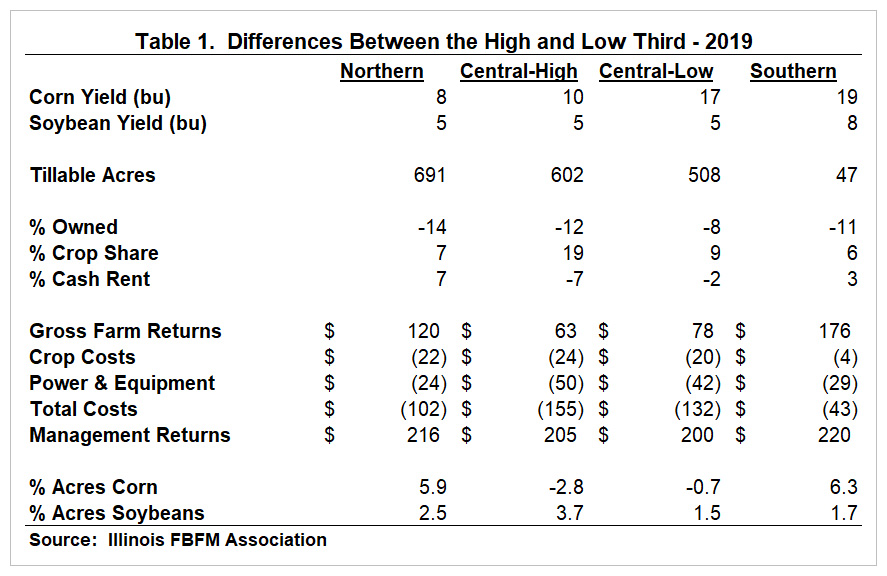
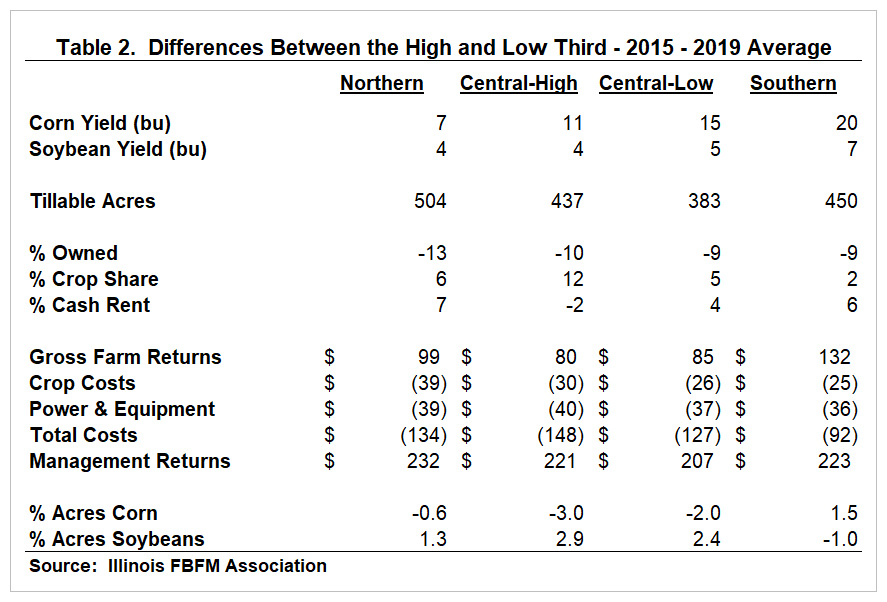
The higher profit farms generally had higher corn and soybean yields. For 2019, the higher profit farms had higher corn yields ranging from 8 bushels per acre in northern Illinois to 19 bushels per acre in southern Illinois. Soybean yields were 5 bushels to 8 bushels per acre higher for the higher profit farms in 2019. The higher corn and soybean yields were the main factor for gross farm returns being $63 per acre to $176 per acre higher for the higher profit farms in 2019. Similar results were found when comparing the 2015 through 2019 average for the higher one-third profit farms to the lower one-third profit farms. Corn yields were 7 bushels to 20 bushels per acre higher for the higher profit farms and soybean yields were 4 bushels to 7 bushels per acre higher. For the five-year average comparison, gross farm returns were $80 to $132 per acre higher.
Crop Rotation
For 2019, more acres were planted to corn than soybeans in northern and southern Illinois for the higher profit farms while in central Illinois the opposite was true with slightly more acres planted to soybeans then corn. For the 2015 through 2019 average, northern and central Illinois planted more acres to soybeans than corn while the opposite was true for southern Illinois.
Farm Size
Farm size seems to be a contributing factor to the profitability as the higher profit farms were noticeably larger, generally from 400 to 700 acres larger depending on the period and the region in the state. The one exception is in southern Illinois where the average size of the farms in 2019 was only 47 acres more for the higher profitable farms. The larger farms are able to spread their labor and machinery costs over more acres contributing to lower costs per acre and higher profitability.
Selected Expenses
Two expense categories were analyzed in the study, crop costs and power and equipment costs. Crop costs include fertilizer, seed and pesticides. The main power and equipment costs are fuel, repairs, machine hire and lease expense and depreciation. Crop costs were $4 to $24 per acre lower in 2019 for the different regions and $25 to $39 per acre less for the different regions for the 2015 through 2019 average comparison. Power and equipment costs were $24 to $50 per acre less in 2019 and $36 to $40 per acre less for the five-year average comparison.
Management Returns
The combination of higher gross returns and lower costs per acre result in significantly higher management returns per acre for the higher profitable farms. For 2019, management returns were $200 to $220 per acre higher for the higher profitable farms and for the 2015 through 2019 average, management returns were $207 to $232 per acre higher.
Summary
Many factors contribute to some farms being more profitable than other farms. A few of these factors, such as weather, farm operators cannot control. However, many factors, such as crop and machinery costs, operators can control. As in past studies of this type, not one single factor is the main contributor to the difference in profitability but many factors put together.
The authors would like to acknowledge that data used in this study comes from the Illinois Farm Business Farm Management (FBFM) Association. Without Illinois FBFM, information as comprehensive and accurate as this would not be available for educational purposes. FBFM, which consists of 5,500+ farmers and 68 professional field staff, is a not-for-profit organization available to all farm operators in Illinois. FBFM field staff provide on-farm counsel along with recordkeeping, farm financial management, business entity planning and income tax management. For more information, please contact our office located on the campus of the University of Illinois in Mumford Hall at 217-333-5511 or visit the FBFM website at www.fbfm.org.
Disclaimer: We request all readers, electronic media and others follow our citation guidelines when re-posting articles from farmdoc daily. Guidelines are available here. The farmdoc daily website falls under University of Illinois copyright and intellectual property rights. For a detailed statement, please see the University of Illinois Copyright Information and Policies here.