


Hiding Behind the Baseline: Big Numbers and the Budget Game
In 1988, the political scientist Aaron Wildavsky warned that the burgeoning set of policies emphasizing budget discipline did not “bode well for the ability to govern” because they could collapse policymaking into zero-sum and then negative-sum games. A central problem was that “[f]ew programs are considered solely on their substantive or political merits” but instead “to what degree do programs contribute to the deficit” or what they cost rather than what they achieve (Wildavsky 1988, at 203, 204, and 250). After more than 35 years of experience, Dr. Wildavsky’s warning appears both prescient and a troubling understatement; the continued impasse over farm bill reauthorization offers a case on point, as discussed herein with respect to realities hiding behind the baseline and big numbers of the Supplemental Nutrition Assistance Program (SNAP).
Background
Farm Bill reauthorization presents a case study of Wildavsky’s warning because of the controlling impact and overriding influence of the 10-year spending projections by the Congressional Budget Office (CBO) known as the baseline. The CBO baseline, combined with budget laws and procedures, requires the agricultural committees to remain inside the spending projections or find offsets from other areas within their jurisdiction to offset 10-year cost projections of any changes. These requirements drastically complicate reauthorization, limit innovation, evolution, and creativity in public policy, as well as place extraordinary pressure on the coalition of interests vital to successfully navigating the legislative process and counting votes in both chambers of Congress. It is most disadvantageous to the largest interests. Figure 1a illustrates the total projected outlays by fiscal year (FY) for the four major mandatory titles in the Farm Bill and Figure 1b illustrates each title’s share (CBO, February 2024).
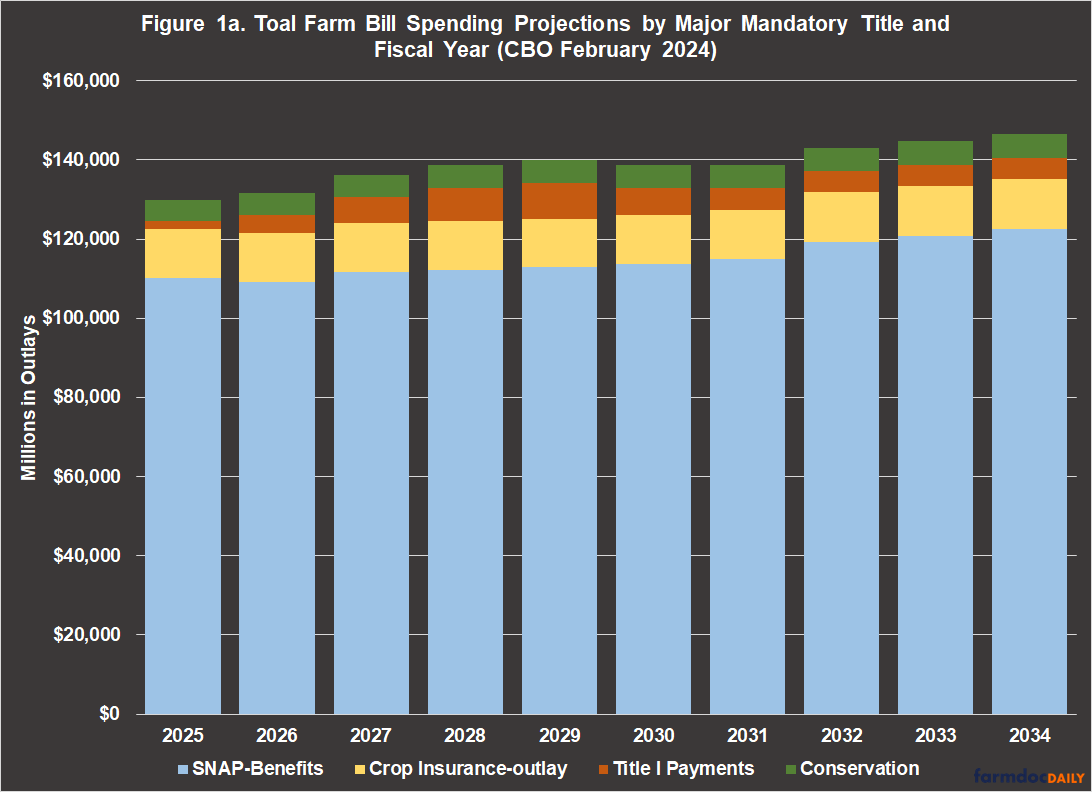
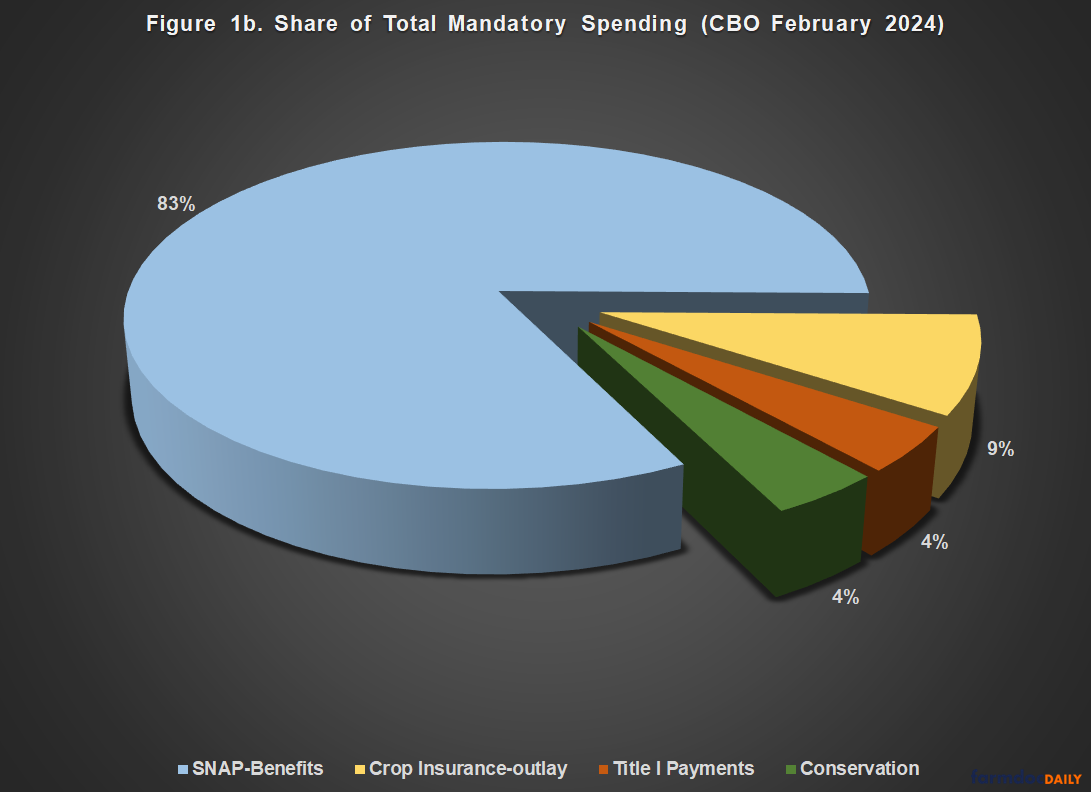
These are certainly large spending projections: $110 billion to $120 billion per fiscal year over the 10-year projection window for SNAP assistance. It can be convenient to hide behind those big numbers, especially for smaller factional interests who derive vast advantages from the budget baseline game.
Discussion
The Supplemental Nutrition Assistance Program (SNAP) assists low-income individuals and households with the purchase of food. Context for the program begins with the people in it. In FY2023, for example, the monthly average participation in SNAP exceeded 42.15 million people every month (USDA-FNS, SNAP Data Tables). SNAP costs the most because it helps the most people.
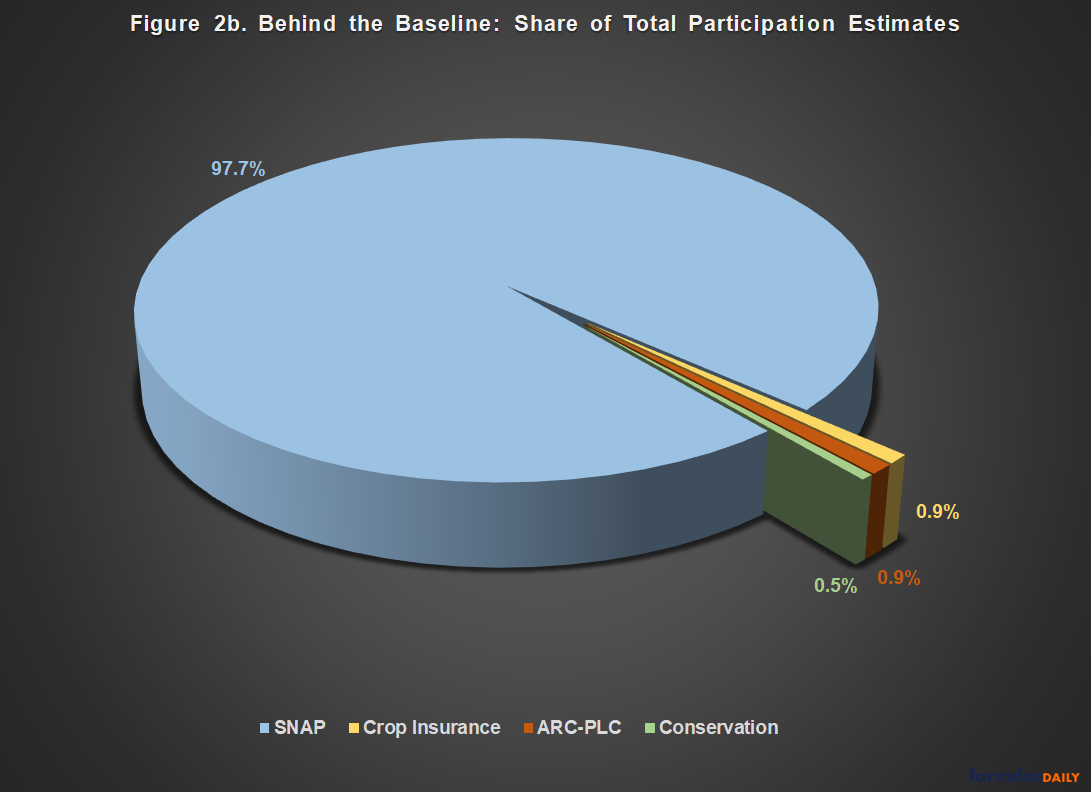
While context is important, comparison is difficult. Consider that the 2022 Census of Agriculture reported a total of 3.37 million producers and 1.9 million farms (USDA, Census of Agriculture, February 13, 2024). Not every producer participates in government programs, however; far fewer ever receive any benefits from the Farm Bill. For example, the highest amount of payment recipients from the Agriculture Risk Coverage (ARC) and Price Loss Coverage (PLC) programs that can be counted in any year from 2014 to 2021 amounts to less than 20% of the producers in the Census (USDA-FSA, Payment Files Information). The Census counted 483,211 total farms (25.4%) receiving government payments. Based on data from the Risk Management Agency (RMA), all crop insurance policies earning premium from 2014 to 2021 would represent only 34% of the producers in the Census (USDA-RMA, Summary of Business). The 2022 Census, however, found only 369,393 farms that enrolled land in crop insurance (19.4% of Census farms), an average of 3 policies per farm. For conservation, roughly 13% of those producers would be represented by the highest number of contracts reported in any of those years (USDA-NRCS, Financial Assistance Program Data; USDA-FSA, Conservation Reserve Program Statistics). Again, the Census counted fewer farmers enrolled in conservation programs (220,388 or 11.6% of Census farms). None of the data, from the Census to conservation, provides an accurate count of participating farmers. These data points do provide context and Figures 2a and 2b use what is available to estimate and compare participation behind the baseline.
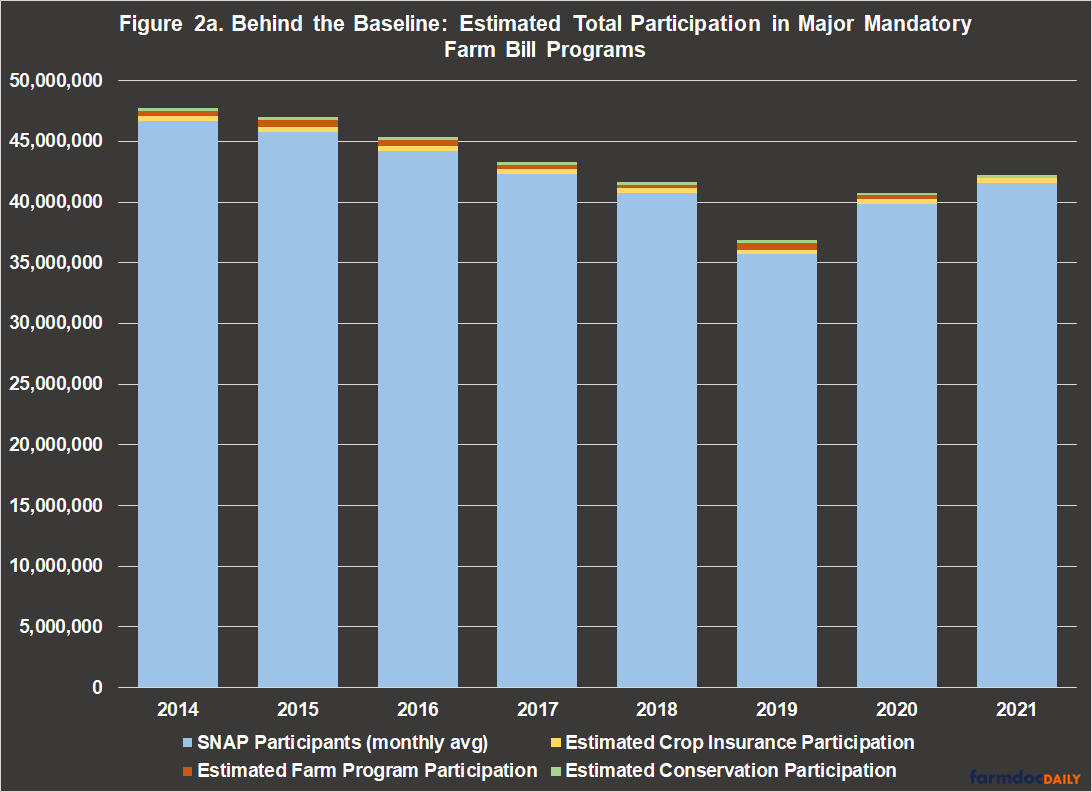
There are numerous caveats and challenges with the data, beginning with the fact that SNAP participation is an average of participation in each month of the fiscal year, while farm programs, crop insurance, and conservation range from annual to multi-year contracts. In addition, individual farmers can receive payments from multiple programs on different crops and farms, purchase subsidized insurance on multiple units, and enter multiple conservation contracts—crop insurance indemnities, farm program payments, and conservation assistance on the same acres. In other words, the participation estimates presented are likely overstating the number of farmers who benefit from farm programs and understate those benefiting from SNAP.
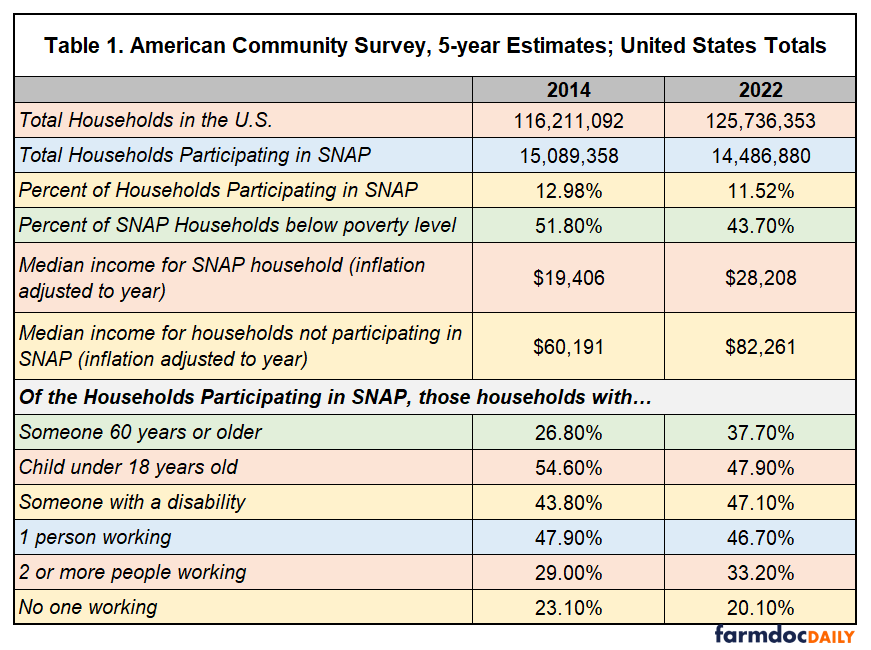
The single most important point that a focus on the big numbers in the baseline misses (or conveniently avoids) is the substantial difference in the number of people participating. SNAP outlays are big not because they are generous but because so many millions fall below poverty measures and receive assistance to put food on the table. Other critical points hidden behind topline numbers are about those receiving assistance, as well as about poverty and unemployment (see, farmdoc daily, April 20, 2023). Table 1 uses data for households participating in SNAP from the U.S. Census Bureau’s American Community Survey (ACS), five-year estimates for 2014 and 2022 (Census-ACS, August 16, 2023). Figure 3 below Table 1 provides an interactive map of the 2022 five-year estimates for each State.
Deeper dives into the people participating in the program participation are also available from USDA’s Food and Nutrition Service (USDA-FNS, SNAP Community Characteristics Dashboard) and other policy experts (see, Hall and Nchako, CBPP, February 13, 2023). Hiding from reality does not change it.
Concluding Thoughts
The appearance of a flurry of snowflakes in February may well signal an approaching snowstorm and a decision: reach for the boots and shovel or allow the warming sun and longer days to melt away the mess. Winter in the Midwest can be a stubborn thing; February’s waning days find farm bill reauthorization similarly situated, struggling to emerge from the shadow of the baseline. Will shedding light on critical facts help? For the Farm Bill, behind the big numbers of the baseline are millions of people—citizens, voters, farmers, families, neighbors—who receive federal assistance in one form or another.
The updated CBO projections provide another reminder of Dr. Wildavsky’s warnings about budget policy’s potential for damaging and counterproductive consequences. Budget policy can bury other priorities under the weight of large, aggregate spending figures, which can often serve convenient means to achieve strategic ends by smaller, factional interests. In 2022, SNAP spent $114 billion on benefits to 41.2 million people on average every month, or about $230.48 every month per participant ($7.68 per day; $2,765.76 per year). According to the Census data, 80% of these households likely included one or two people who were employed, while nearly half had at least one child and a roughly similar share included a person with a disability. These realities matter because SNAP provides relatively modest benefits; therefore, reducing the program’s topline outlays generally requires changes in law that kick participants out of the program or preclude them from participating (including additional paperwork burdens for enrolling). Ignoring these realities may be strategic or convenient, but hiding behind the baseline a more complete story exists that better informs public debate for public policy.
References
Hall, Lauren and Catlin Nchako. “A Closer Look at Who Benefits from SNAP: State-by-State Fact Sheets.” Center on Budget and Policy Priorities. February 13, 2023. https://www.cbpp.org/research/a-closer-look-at-who-benefits-from-snap-state-by-state-fact-sheets#Arkansas.
Center on Budget and Policy Priorities. “SNAP: State by State Data, Fact Sheets, and Resources.” Updated February 13, 2023. https://www.cbpp.org/research/food-assistance/snap-state-by-state-data.
U.S. Census Bureau. “Why We Aks Questions About…Food Stamps/Supplemental Nutrition Assistance Program (SNAP).” https://www.census.gov/acs/www/about/why-we-ask-each-question/food-stamps/.
Wildavsky, Aaron. The New Politics of the Budgetary Process (Glenview: Scott, Foresman, 1988).
Disclaimer: We request all readers, electronic media and others follow our citation guidelines when re-posting articles from farmdoc daily. Guidelines are available here. The farmdoc daily website falls under University of Illinois copyright and intellectual property rights. For a detailed statement, please see the University of Illinois Copyright Information and Policies here.