How the Composition of U.S. Commercial Banks Participating in Agricultural Lending has Changed Since 2007
According to data from the Federal Deposit Insurance Corporation, unrealized losses on available-for-sale and held-to-maturity securities increased by $39 billion to $517 billion in the first quarter of 2024, primarily driven by higher mortgage rates impacting the fair market values of mortgage-backed securities (FDIC Quarterly Banking Profile 2024Q4). Although almost 17 years have passed since the Great Financial Crisis, the U.S. banking industry has recovered and appears resilient, despite rising commercial real-estate concerns (Kollmeyer, 2024). Over this period, the total assets of FDIC-insured commercial banks have doubled, increasing from $11.079 trillion in 2007 to $22.361 trillion in 2023 (FDIC BankFind Suite). Among the assets held by commercial banks, agricultural loans have also increased in size. In this article, we will compare how agricultural lending by FDIC-insured commercial banks has evolved since 2007. Two lending specialization categories are defined since some commercial banks extend more credit for agricultural purposes than others. Commercial banks whose sum of farmland and production loans exceeds 25% of their net loans and leases are defined as agricultural banks, while all others are defined as non-agricultural banks.
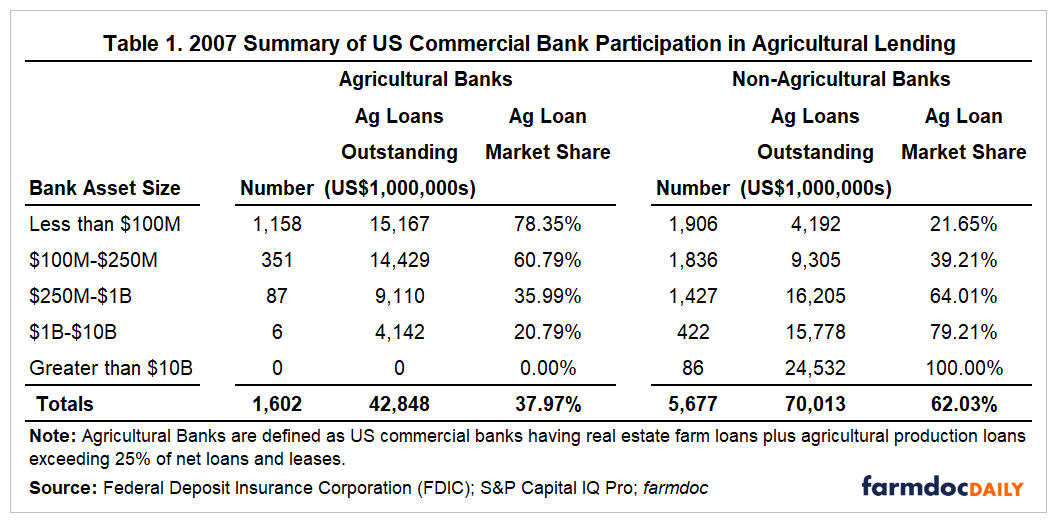
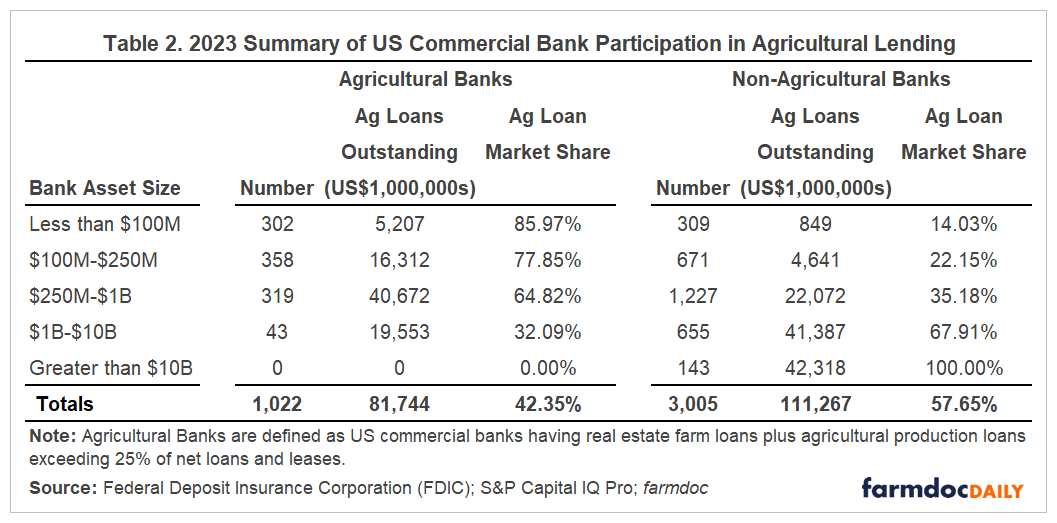
Tables 1 and 2 show the distribution of commercial banks by bank asset size and lending specialization in 2007 and 2023, respectively. Compared to non-agricultural banks, agricultural banks have a smaller market share of outstanding agricultural loans. From 2007 to 2023, agricultural loans held by agricultural banks increased from $42.848 billion to $81.744 billion, a 90.78% increase, while the balance held by non-agricultural banks increased from $70.013 billion to $111.267 billion, a 58.92% increase. During this period, agricultural banks increased their overall market share from 37.97% to 42.35%. However, the number of commercial banks declined considerably over the same period, mainly due to mergers and acquisitions. In 2007, there were 1,602 agricultural banks and 5,677 non-agricultural banks. By 2023, the number of agricultural banks had fallen to 1,022, representing a 36.20% decline, while the number of non-agricultural banks had decreased to 3,005, a 47.07% decline.
At a more granular level, agricultural banks increased their market share across all bank asset sizes except for the category of banks with assets greater than $10 billion. Notably, agricultural loans held by smaller commercial banks of both specializations with a bank asset size of less than $100 million decreased. For agricultural banks, the value fell from $15.167 billion in 2007 to $5.207 billion in 2023, while it fell from $4.192 billion in 2007 to $849.463 million for non-agricultural banks. However, this still represented an increase in the market share for agricultural banks in this asset size category. The amount of agricultural loans held by agricultural banks increased for those with a bank asset size of $100 million to $250 million, from $14.429 billion to $16.312 billion, while the amount fell from $9.305 billion to $4.641 billion for non-agricultural banks. Agricultural banks in the $250 million to $1 billion category experienced their largest dollar amount increase over the period, increasing by $31.561 billion, while non-agricultural banks in the $1 billion to $10 billion category experienced theirs, increasing by $25.609 billion. As of 2023, non-agricultural banks with an asset size greater than $10 billion hold the largest share of outstanding agricultural loans amongst all commercial banks ($42.318 billion), followed by non-agricultural banks with total assets between $1 billion and $10 billion ($41.387 billion). The third largest share is held by agricultural banks with total assets between $250 million and $1 billion ($40.672 billion).
Conclusion
It is evident that in almost two decades, commercial banks participating in agricultural lending have experienced significant changes. The increase in agricultural loans held by both agricultural and non-agricultural commercial banks reflects the evolving nature of the commercial banking industry and the agricultural sector. Despite the overall decline in the number of commercial banks over the period, banks specializing in agricultural lending have managed to expand their market share, and the volume of loans issued.
References
Federal Deposit Insurance Corporation. (2024). FDIC Quarterly Banking Profile: First Quarter 2024. Retrieved from https://www.fdic.gov/news/speeches/fdic-quarterly-banking-profile-first-quarter-2024
Federal Deposit Insurance Corporation. (2023). BankFind Suite: Historical data on banks. Retrieved from https://banks.data.fdic.gov/bankfind-suite/historical?displayFields=BANKS%2CASSET%2CDEP%2CEQNM%2CNETINC&endDate=2023&pageNumber=1&resultLimit=25&searchPanelExpand=true&selectedReport=CBF&selectedStates=99&sortField=YEAR&sortOrder=DESC&startDate=2007
Kollmeyer, B. (2024, June 7). Moody's puts several U.S. regional banks on downgrade review over commercial real-estate concerns. MarketWatch. Retrieved from https://www.morningstar.com/news/marketwatch/20240607234/moodys-puts-several-us-regional-banks-on-downgrade-review-over-commercial-real-estate-concerns
Disclaimer: We request all readers, electronic media and others follow our citation guidelines when re-posting articles from farmdoc daily. Guidelines are available here. The farmdoc daily website falls under University of Illinois copyright and intellectual property rights. For a detailed statement, please see the University of Illinois Copyright Information and Policies here.


