


US Interest Rates and the Price of Capital
Public discussions often overlook that interest rates are a market determined price of capital in addition to being a policy instrument of the Federal Reserve. Herein, we examine historical trends in various, but not all, sources of funds and briefly list various current sizeable demands for funds. Lower supply relative to demand will typically cause pressures leading to higher interest rates.
US Saving Rate
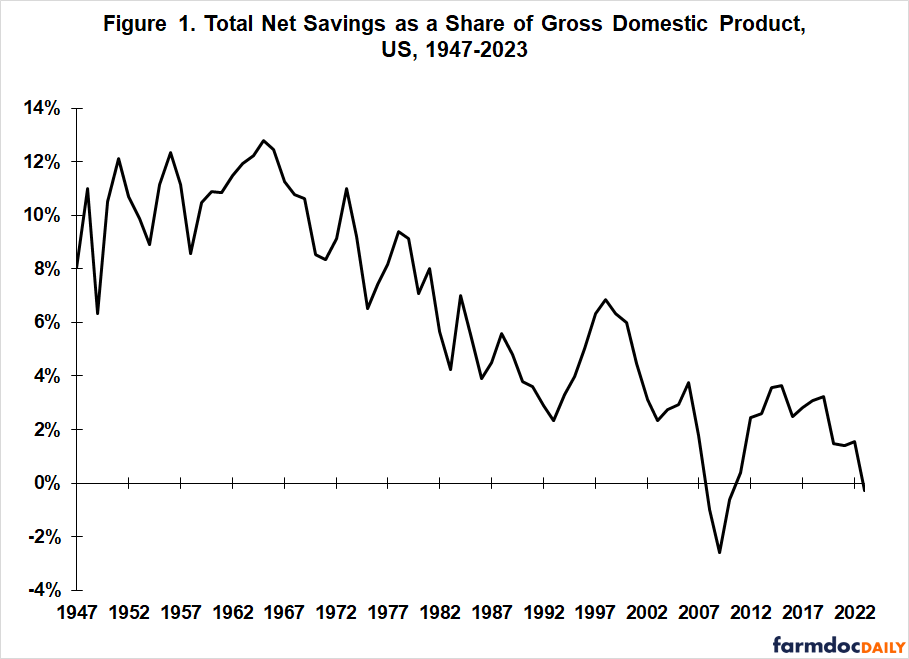
Total US net savings expressed as a share of US gross domestic product has declined since the mid-1960s (see Figure 1). It averaged 10.1% over 1947-1956, the first 10 years of the period in Figure 1, compared with 2.3% over the last 10 years (2014-2023). It is not clear if the savings rate is continuing to decline or is stabilizing. The last five years suggest the decline is continuing. However, a longer period dating to the early 1990s suggests stabilization with large variation could also be occurring. Source for the data used to examine US saving rate is the Federal Reserve Economic Data files (FRED) maintained by the Federal Reserve Bank of St. Louis.
US Saving Rate by Sector
The US saving rate can be disaggregated into the saving rate for domestic businesses, household and institutions, and governments (primarily federal but also state and local). The saving rate of domestic US businesses has averaged +3.4% since 1947 (see Figure 2). No apparent trend exists and year-to-year variation ranges only from +1.7% (2008) to +5.8% (2010). Average rate for these two years, both of which occurred during the US housing crisis, is +3.7%, or near the long run average.
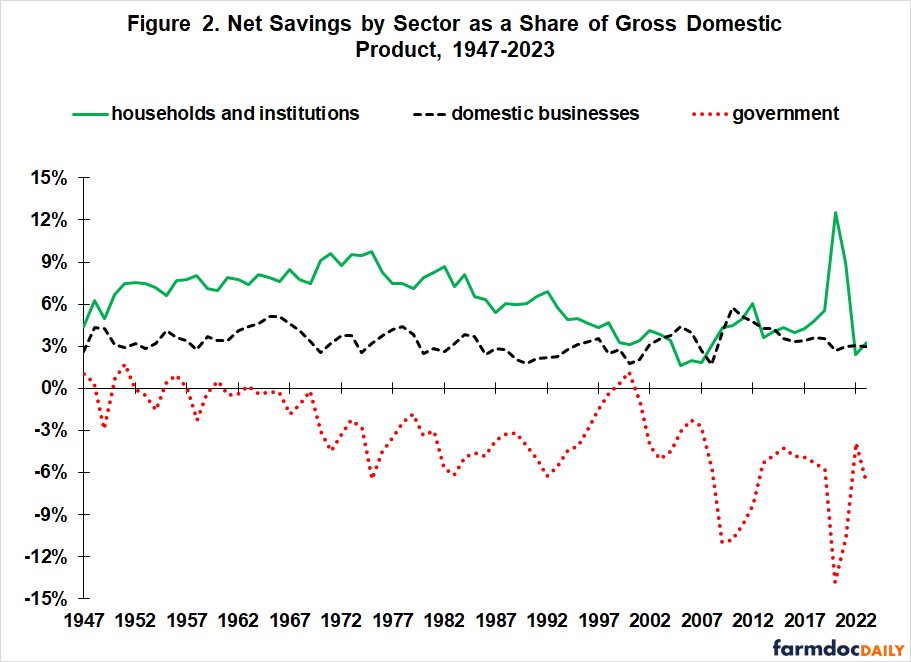
The saving rate of US households and institutions averaged +7.7% from 1947 through 1985. It then began a long decline before possibly stabilizing in the +3-4% range. A spike in 2020 and 2021 coincided with large government transfer payments during the COVID pandemic. The saving rate for 2023 is +3.3%. If the saving rate of US households and institutions is stabilizing in the +3-4% range, it will be roughly the same as the long-term saving rate of US domestic businesses.
Saving rate of US governments averaged -0.3%, or slightly negative, from 1947 through 1969. Since 1970, it has averaged -4.6% with large year-to-year fluctuations. The range was -13.1% (2020, i.e. COVID lockdown year, with decidedly negative savings also during the housing financial crisis) to +1.2% (2000, with 1999 also positive). For 2023, US government saving rate was -6.6%.
The high variability makes it difficult to assess recent trends with reliability. However, a noticeable shift to larger deficits has occurred since the 1970s. Moreover, the decline in the US government saving rate is a major component of the decline in the total US saving rate since the surpluses of 2000.
Foreign Investment in US
Foreign investors have been a major source of capital for the US throughout its history. Figure 3 presents new foreign direct investment in the US as a share of US gross domestic product. The data are based on a survey conducted by the Bureau of Economic Analysis. The data start with 1999. No survey was conducted in 2009-2013. The average share for the periods before and after the break is nearly the same at 1.5% and 1.4%, respectively; implying no trend exists. New acquisitions have, on average, accounted for 94% of new foreign direct investment.
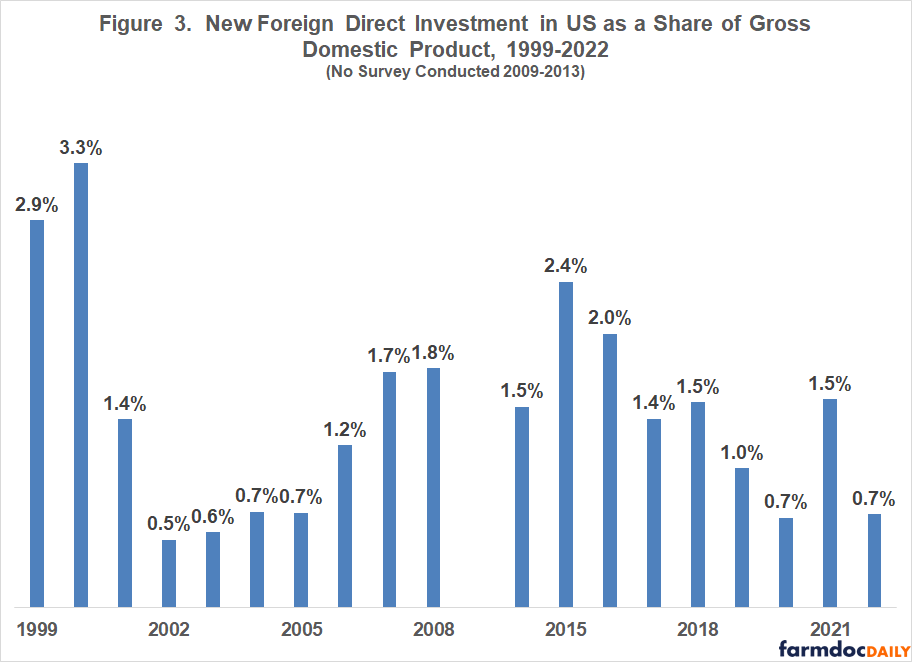
Figure 4 presents the share of US public Federal debt held by foreign and international investors since 1970, the first year FRED reports such data. The share increased between 1970 and 2014, when it peaked at 34%. It has since declined to 23.5% in 2023. The decline does not appear to be slowing.
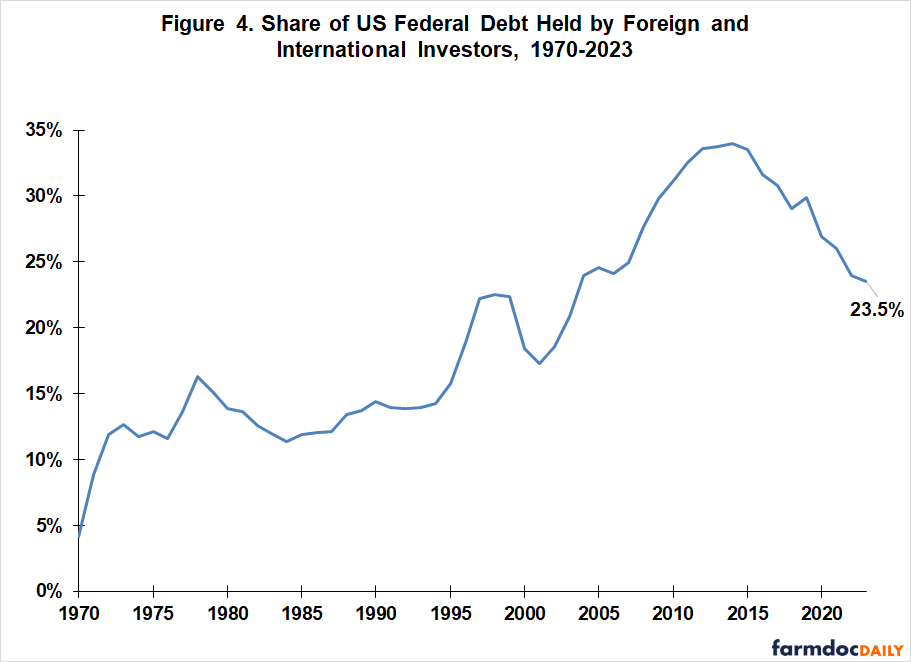
It is important to note that foreign and international investor holding of US public Federal debt in dollars has not declined. Their holding increased from $6.1 trillion in 2014 to $7.7 trillion in 2023. Nevertheless, the decline in share is large enough to prompt these questions, “What is the cause?” and “Does it signify a loss of confidence in the US government?” Whatever the answers, this share is worth monitoring. If it had remained at 34%, foreign and international investors would hold $3.4 trillion more in US Federal debt securities. This money has instead come from other sources.
US Demand for Capital
The US currently has several large demands from government policy and private markets for capital:
- Reconfiguration of the supply chain due to heightened international political risks, often bringing it closer to home, particularly for critical industries (see, for example, Council of Economic Advisors, November 30, 2023).
- Transition from carbon-based to renewable energy, driven by government policy and private markets, and requiring sizable investments in production and distribution facilities (see, for example, Annex, August 21, 2023).
- Investments to replace and upgrade US transportation infrastructure (see Infrastructure Investment and Jobs Act of 2021).
- Rapid growth of artificial intelligence, requiring sizable investment in data centers and energy networks to support them (see, for example, Goldman Sachs, May 14, 2024).
Discussion
Interest rates are more than a policy instrument of the Federal Reserve. They are the price of capital.
Moreover, in pursing monetary policy, Congress has instructed the Federal Reserve to pursue the widely-noted goals of promoting maximum employment and stable prices but also the economic goal of moderate long-term interest rates (Board of Governors of the Federal Reserve System).
This article is not an exhaustive examination, but sizable demand for capital intensive projects in the transportation, energy, supply chain, and artificial intelligence sectors; a declining US saving rate; and cooling in international investor demand for US Federal Debt suggest that, even if inflation declines to the Federal Reserve’s target rate of 2%, US interest rates may need to remain high to supply current and near future US demand for capital.
In short, the Federal Reserve manages, not controls interest rates. Markets ultimately set rates.
Future direction of the saving rate of US households and institutions and US governments are important to monitor given their long-term decline.
It would also be useful to understand why the saving rate of US domestic business is so consistent at 3%-4% annually and what this is telling us about the US capital market and interest rate policy.
References and Data Source
Annex, M. August 21, 2023. Renewable Energy Investment Hits Record-Breaking $358 Billion in 1H 2023. BloombergNEF. https://about.bnef.com/blog/renewable-energy-investment-hits-record-breaking-358-billion-in-1h-2023/
Bureau of Economic Analysis, Department of Commerce. July 10, 2023. New Foreign Direct Investment in the United States. https://www.bea.gov/data/intl-trade-investment/new-foreign-direct-investment-united-states
Board of Governors of the Federal Reserve System. July 2024. Monetary Policy. https://www.federalreserve.gov/monetarypolicy.htm
Federal Reserve Bank of St. Louis. May 2024. Federal Reserve Economic Data (FRED). https://fred.stlouisfed.org
Council of Economic Advisors. November 30, 2023. Issue Brief: Supply Chain Resilience. https://www.whitehouse.gov/cea/written-materials/2023/11/30/issue-brief-supply-chain-resilience/
Goldman Sachs. May 14, 2024. AI is posed to drive 160% in data center power demand. https://www.goldmansachs.com/intelligence/pages/AI-poised-to-drive-160-increase-in-power-demand.html
117th US Congress. November 15, 2021. Infrastructure Investment and Jobs Act. https://www.congress.gov/bill/117th-congress/house-bill/3684
Disclaimer: We request all readers, electronic media and others follow our citation guidelines when re-posting articles from farmdoc daily. Guidelines are available here. The farmdoc daily website falls under University of Illinois copyright and intellectual property rights. For a detailed statement, please see the University of Illinois Copyright Information and Policies here.