


Corn and Soybeans Economics in 2024 and 2025: Back to the New (Old) Normal?
In recent months, corn and soybean prices have trended lower, leading to questions about longer-run prices. Recent price patterns suggest that 2021 through 2023 was a transitory period of higher prices, and now we may be returning to a period of lower prices. Those price patterns are reminiscent of the past, suggesting potential for a multi-year period of lower incomes. Overall, thoughtful use of financial resources is prudent, as is always the case in Corn-belt farming.
2024 and 2025 Projected Corn and Soybean Prices
In its June World Supply and Demand Estimates (WASDE) report, the U.S. Department of Agriculture (USDA) projected the 2024 corn price at $4.40 per bushel. This 2024 price is the market year average price for the U.S. from September 2024 to August 2025. The $4.40 price is down from the 2023 price of $4.75 and is a considerable drop from the recent high of $6.54 per bushel for the 2022 marketing year (see Figure 1). USDA does not currently provide a projected price for 2025, but futures markets indicate another slight decline to $4.25 per bushel.
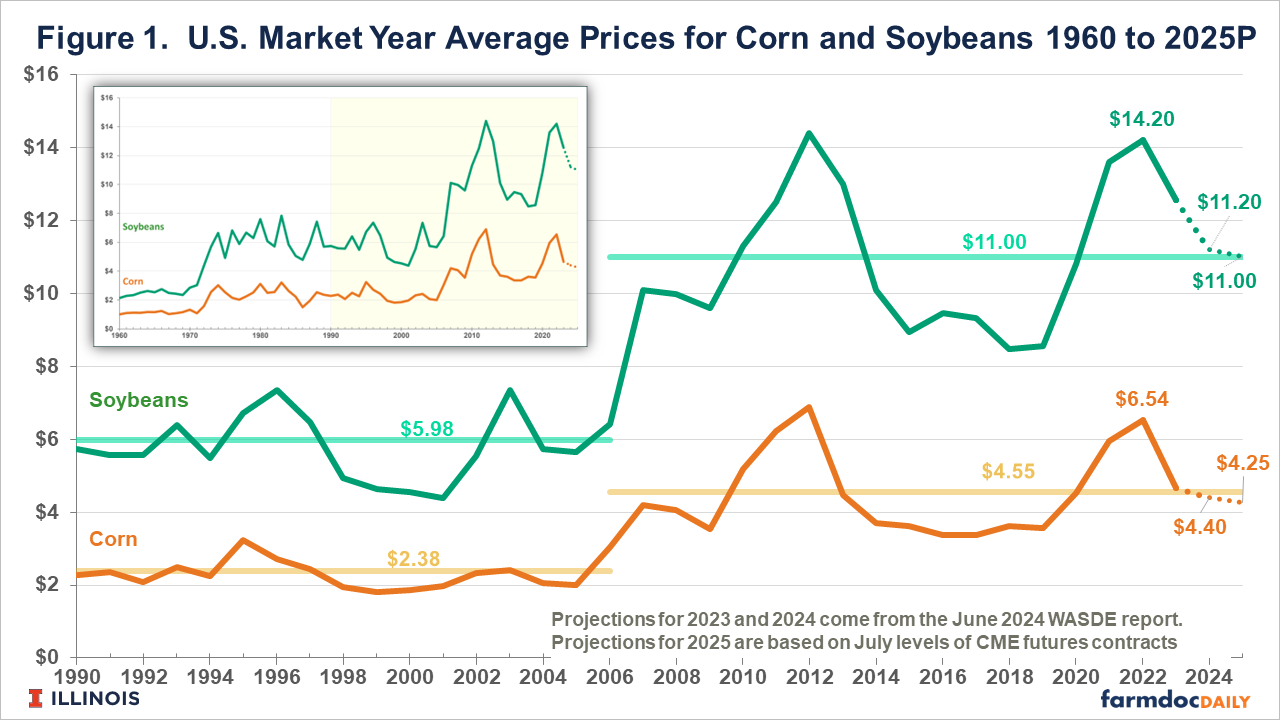
Similarly, soybean prices have declined from recent 2022 highs. Soybean prices averaged $14.20 per bushel in 2022, falling to $12.55 in 2023, with a projection of $11.20 per bushel for 2024 (see Figure 1). Futures markets suggest a 2025 price of $11.00 per bushel.
The highs in 2022 led to hopes that corn and soybeans had reached new higher levels. Current prices and projections suggest that those hopes are in the process of being dashed. A reasonable working model is that the high prices were caused by short-lived supply and demand conditions, including the rebuilding of China’s swine herd in 2020, the Ukraine-Russia war which disrupted supplies from that region and increased overall market uncertainty, and lack-luster yield performance in Brazil, Argentina, and the U.S. in recent years.
Commodity prices exhibit long periods in which they vary around a long-run plateau, with those plateaus changing rarely only when permanent market shocks are realized. From 1974 to 2006, corn and soybean prices averaged $2.38 and $5.98 per bushel, respectively. There were periods in which prices were well above those long-run averages. For example, corn prices exceeded $3.00 in 1974, 1980, 1983, and 1995. After each one of those higher prices, corn prices again declined and fell below the $2.38 plateau.
In the mid-2000s, both corn and soybean prices reached higher plateaus. Since 2006, the average corn price has increased from $2.38 per bushel to $4.55 per bushel, and average soybean prices have increased from $5.98 per bushel to $11.00 per bushel. Those increases were caused by increased corn use for ethanol and strong sustained growth in export demand for soybeans.
Since 2006, there have been two periods when corn and soybean prices exceeded the $4.55 and $11 plateaus. In 2012, corn and soybean prices hit highs of $6.89 per bushel for corn and $14.40 for soybeans. Those higher prices were attributed to supply shortfalls around the world leading into 2012, with the Midwest drought of 2012 causing even lower corn supplies and higher prices. The most recent period of higher prices occurred from 2021 to 2023.
Between the high price periods, commodity prices can spend considerable time below their longer-run averages. For example, both corn and soybean prices were below long-run plateaus over the following multi-year periods:
- 1985 to 1992. During this eight-year period, corn prices were below the $2.38 plateau, and soybeans prices were below the $5.98 plateau in all but one year: 1988. The 1988 drought pushed prices higher, but the increase was short-lived.
- 1998 to 2005. During this eight-year period, prices were below their plateau except in 2003.
- 2014 to 2020. During this seven-year period, corn prices fell below $4.55, and soybean prices remained below the $11 plateau in all years.
At this point, the high prices in 2021 and 2023 appear to be driven by short-run factors and not by changes to fundamental supply-demand conditions. If true, then we expect to see a period of lower prices, with no or little change in the plateaus of $4.55 corn and $11.00 soybeans. How long a lower price period may last is unpredictable, just as the factors that cause higher prices are unpredictable. The period could end if yields in the U.S. are below average in 2024. However, chances of below-average yields appear to be diminishing as the growing season progresses. Other factors could push prices higher in 2024, such as changes in the Ukraine-Russia conflict. While those possibilities exist, history also suggests that a lower price period could also persist for seven or eight years.
Returns and Management Decisions
Lower prices bring in a period of lower returns and lower farm incomes, with cost adjustments typically lagging prices. In that respect, the next few crop years could be much like that of the period from 2014 to 2020, the most recent period of lower prices and returns. This period was associated with:
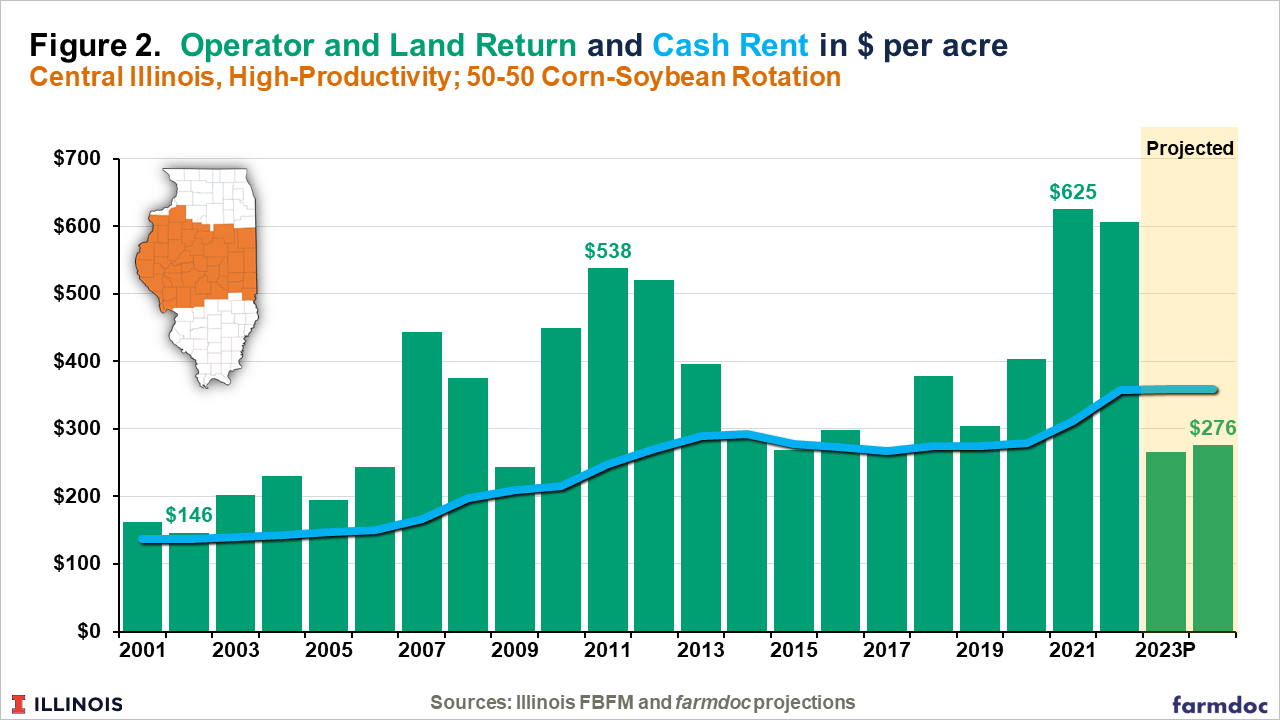
- Lower returns. Figure 2 shows operator and land returns from 2000 to 2024P for central Illinois farmland. Operator and land returns represent returns to both the farmer and farmland. Those operator and land returns fell after the high prices in 2012, reaching a lower level from 2014 to 2019. Those low returns resulted in lower net farm incomes for grain farms in Illinois, with a nearly $0 net income in 2015 (see farmdoc daily, November 15, 2022).
- Slight declines in input costs. Costs can be expected to decline on some inputs, with fertilizer and fuel being the most likely to decline (farmdoc daily, June 18, 2024). Other inputs, such as seed and pesticides, can be expected to stabilize (see farmdoc daily, April 30, 2024).
- Downward cash rent pressures. From 2014 to 2019, operator and land returns were near or below cash rents, leading to a period of stable and slightly declining cash rents (see Figure 2).
- Decreases in farm financial position. From 2014 to 2019, average debt-to-asset ratios increased, and current ratios decreased (see farmdoc daily, November 15, 2022). Slight deteriorations in financial positions likely will begin in 2024 and continue until prices improve.
Summary and Commentary
Extended periods of lower corn and soybean prices have been experienced in the past and, in fact, should likely be viewed as the norm. As such, suggested responses to price downturns are well known, and include the usual thoughtful use of financial reserves. Overall, higher incomes from 2020 to 2023 put most farms in solid financial positions such that weathering a period of lower prices and returns is possible. As is usually the case in these periods, younger farmers with fewer financial reserves, higher debt loads, and the need to grow the operation will face the most financial stress.
Returns to farming have declined, suggesting that cash rents should decline as well. The process of lowering cash rents lags that of lower incomes. How quickly or how much cash rents decline will depend on how far commodity prices fall, as well as potential policy responses to those price declines. Those dynamics will play out in the near future, suggesting that farmland markets bear watching.
References
Paulson, N., G. Schnitkey and C. Zulauf. "Where Might Nitrogen Fertilizer Prices Be Headed?" farmdoc daily (14):114, Department of Agricultural and Consumer Economics, University of Illinois at Urbana-Champaign, June 18, 2024.
Paulson, N., C. Zulauf and G. Schnitkey. "Trends in Input Costs for Corn and Soybean Production in Illinois." farmdoc daily (14):82, Department of Agricultural and Consumer Economics, University of Illinois at Urbana-Champaign, April 30, 2024.
Schnitkey, G., C. Zulauf, N. Paulson and J. Baltz. "Grain Farm Income Projections for 2022 and 2023." farmdoc daily (12):172, Department of Agricultural and Consumer Economics, University of Illinois at Urbana-Champaign, November 15, 2022.
USDA. World Agricultural Supply and Demand Estimates (WASDE – 649, June 2024). Released June 12, 2024. http://www.usda.gov/oce/commodity/wasde/
Disclaimer: We request all readers, electronic media and others follow our citation guidelines when re-posting articles from farmdoc daily. Guidelines are available here. The farmdoc daily website falls under University of Illinois copyright and intellectual property rights. For a detailed statement, please see the University of Illinois Copyright Information and Policies here.