


Tenure Characteristics of Illinois Farmland
Data from the Illinois Farm Business Farm Management (FBFM) Association provides insights into leasing arrangements in Illinois. Table 1 contains data summarized from Illinois grain farms enrolled in FBFM. These farms receive most of their farming income from grain operations and farm at least 500 acres. Although this data is representative of commercial grain farms in Illinois, it is not a statistical sample of all commercial grain farms in the state.
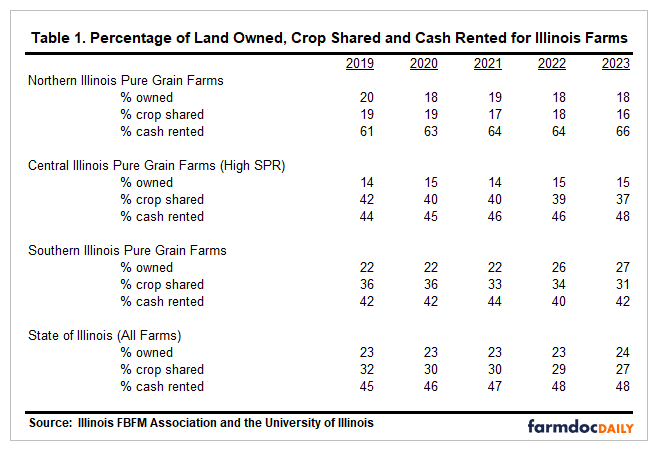
For the year 2023, farm operators enrolled in FBFM owned 24 percent of the land they farmed, crop shared 27 percent, and cash rented 48 percent (Table 1). For crop share arrangements, farmers and landowners share in the revenue and expenses associated with farming. For cash rent arrangements, farmers pay landowners a cash payment and receive all the revenue and pay all the operating expenses from farming the land. Variable cash rent leases are classified as land cash rented in this analysis.
There has been a small but continual shift in types of leases from crop share leases to cash rent leases. From 2019 to 2023, the amount of land crop shared decreased from 32 percent to 27 percent while the amount of land cash rented increased from 45 percent to 48 percent. While there is more land cash rented then crop shared, there is still a significant amount of farmland leased under a crop share arrangement. The last year where a larger amount of the farmland was crop shared compared to cash rented was in 2006. Since then, there has been more land cash rented than crop shared.
The amount of land leased under a crop share or cash rent basis varies by geographic region in the state. For example, in 2023, farmers in northern Illinois cash rented 66 percent of their land and crop shared 16 percent while central Illinois farmers cash rented 48 percent and crop shared 37 percent. Farmers in the southern part of the state cash rented 42 percent of their land and crop shared 31 percent.
The amount of land owned by farm operators also varies by geographic region in the state. Southern Illinois farm operators own 27 percent of their land while central Illinois operators own only 15 percent. Operators in northern Illinois own 18 percent. From 2019 to 2023, the amount of land owned by operators has relatively stayed the same. On a statewide basis, operators owned 24 percent of their land in 2023. Farms continue to grow and farm operators are a significant percentage of the farmland buyers but the relationship of the amount of land owned by farm operators to the total amount of land farmed has not really changed.
When you split the farms based on management returns, or economic profitability, there are some differences in the high third and low third for the different regions of the state. Economic profitability is based on accrual net income but showing a charge to unpaid labor and using interest charges for non-land and land ownership instead of interest paid. In Table 2, the ten-year average of the high third, low third and the difference is shown for the same three regions as in Table 1. Generally, the high third group for management returns owned less land and crop shared more acres. For example, in central Illinois with the high productivity ratings, the high third group owned 8 percent less, crop shared 13 percent more and cash rented 5 percent less than the low third group. Central Illinois differed from Northern and Southern Illinois by the high third cash renting less percent of the acres than the low third. This difference is primarily because the largest percentage of crop shared acres are in central Illinois.
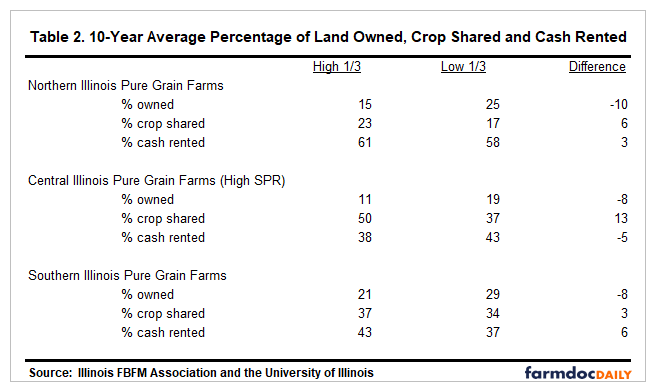
In Illinois, the percentage of acres that make up a farming operation differs from North to South. There are more cash rent acres as a percent of land operated in Northern Illinois, more crop shared acres percentage in Central Illinois and more owned acres percentage in Southern Illinois. These differences are due to soil productivity, types of operations and different cultures or practices for those regions. When we look at the differences in the operations that are in the top third of economic profitability, those operations tend to own less ground and crop share a larger percentage of those acres in their operation than the low third. Each operation is different and understanding true economic returns to each way of controlling land helps understand the impact of adding each type. Good recordkeeping and analyzing your trends over time help to gain this understanding.
The author would like to acknowledge that data used in this study comes from Illinois Farm Business Farm Management (FBFM) Association. Without their cooperation, information as comprehensive and accurate as this would not be available for educational purposes. FBFM, which consists of 5,000 plus farmers and 70 plus professional field staff, is a not-for-profit organization available to all farm operators in Illinois. FBFM field staff provide on-farm counsel with computerized recordkeeping, farm financial management, business entity planning and income tax management. For more information, please contact the State FBFM Office located at the University of Illinois Department of Agricultural and Consumer Economics at 217-333-8346 or visit the FBFM website at www.fbfm.org.
Disclaimer: We request all readers, electronic media and others follow our citation guidelines when re-posting articles from farmdoc daily. Guidelines are available here. The farmdoc daily website falls under University of Illinois copyright and intellectual property rights. For a detailed statement, please see the University of Illinois Copyright Information and Policies here.