


Is the Ethanol Mandate Truly a Mandate? An Estimate of Banked RINs Stocks
Rapid and continued growth in the ethanol market is widely acknowledged to be a major component in the increase in grain prices we’ve experienced since 2005. To date, the economics of ethanol blending, through the blend margin between ethanol and gasoline prices and the tax credit available to ethanol blenders through 2011, have been able to support continued growth in ethanol and corn demand (see the post from December 15 for more information). Despite the potential for these conditions to change, the renewable fuel mandates outlined under the current Renewable Fuel Standard (RFS2) are often cited as a justification for a continued bullish outlook or, at the very least, a safety net for the corn market. However, the ability of fuel blenders to shift portions of their mandate compliance across time using Renewable Identification Numbers (RINs) could result in negative shocks to corn demand for ethanol even under binding and enforced renewable fuel mandates.
RINs are the basis of the accounting system created by the Environmental Protection Agency (EPA) for use in enforcing the fuel mandates outlined under the RFS2. A RIN is a 38-digit number assigned to each gallon or batch of renewable fuel produced or imported into the U.S. Each RIN travels through the supply chain with the biofuel it is associated with until it is separated, at which point the RIN can be applied towards the mandate of an obligated party (fuel blender) or traded among other obligated parties or speculative traders, potentially for application towards the mandate at a future time. Thus, the RINs system allows obligated parties to meet their individual mandates by applying RINs representing biofuels which they have physically purchased and blended, or those which were purchased from another party through RIN trading.
The rules and processes for creating, separating, trading, and applying RINs towards an obligated party’s mandate are both interesting and fairly complex. In future posts I intend to provide more information about issues such as the lifetime or maturities of a RIN and how the timing of their creation impacts the time periods in which they can be applied towards the mandate. Additionally, the structure of the RFS2 mandates across conventional, advanced, and cellulosic ethanol and biodiesel creates a similar hierarchical structure in the types of RINs that are created, with conditions in each of these renewable fuels’ markets impacting the value of each RIN type. In today’s post I focus on conventional ethanol (corn-based ethanol) and the “banking” and “borrowing” provisions, which allow obligated parties to apply RINs created in previous or future periods towards their current period’s mandate.
The “banking” provision associated with the RFS2 and RIN trading system allow obligated parties to bank up to 20% of their current year’s mandate level in RINs for use in future years. Using an example to illustrate, let’s assume an obligated party’s mandate level was 1 million gallons of conventional ethanol in 2011 1, and that this obligated party purchased a total of 1.3 million total RINs in 2011 either through the purchase of conventional ethanol with their RINs still assigned, or the purchase of RINs which had been separated from the physical fuel. The obligated party would then apply 1 million of these conventional RINs towards their mandate for the year, leaving them with a balance of 300 thousand additional RINs. Up to 200 thousand (20% x 1 million mandate level) could be banked for use the following year, and the remaining 100 thousand could then be sold to other obligated parties or speculators.
A “borrowing” provision works in a similar way. Let’s assume another obligated party also has a 1 million gallon conventional ethanol mandate for 2011, but they only purchased 750 thousand RIN contracts during the year. Again, this could be through the purchase of physical renewable fuel with RINs still attached, or by purchasing separated RIN contracts from another blender or trader. To meet the current year’s mandate, the obligated party needs to come up with an additional 250 thousand gallons in RINs by purchasing additional RINS, borrowing against their mandate in future periods, or some combination of both. Given their current mandate level of 1 million gallons, the obligated party could borrow up to 200 thousand in RINs against next year, which would effectively increase their mandate for the following year by the same amount. The blender would then need to purchase the final 50 thousand RINs to be able to meet their mandate for the current year.
The allowance for these banking and borrowing provisions allows for the building of positive or negative RIN “stock” levels and can thus impact the effective mandate in any given year at both the individual blender and aggregate levels. Since the RIN system was established in 2007, more RINs have been created (through production or imports) than have been needed for application toward RFS2 mandate levels in each year.
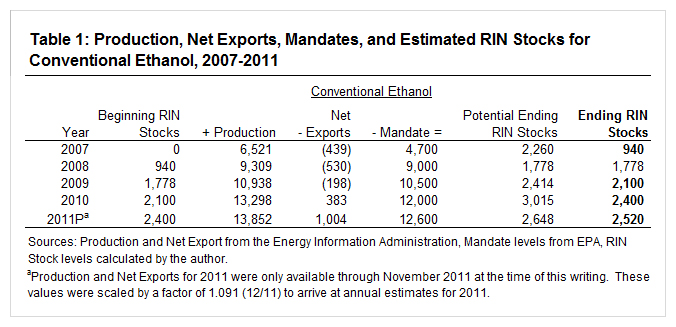
One method for calculating RIN stocks in any given year is as follows:
- Potential Ending RIN Stocks = Beginning RIN stocks + Domestic Production ? Net Exports ? Mandate
- Ending RIN Stocks = minimum of: Potential Ending RIN Stocks, 20% x Current Mandate
Potential ending stocks are simply beginning stocks plus additional RINs created through domestic production and net trade, less the RINs required for use in that period toward the mandate. Actual ending stocks are then equal to the lesser of potential ending stocks, or 20% of that year’s mandate given the limitation on banking RINs across years. With the passage of RFS2 and creation of the RIN system in 2007, we can estimate the current stock of conventional RINs by calculating this stock flow over time. The stock calculations are provided below in table 1. Starting in 2007 with a zero balance of conventional RIN stocks, almost 7 billion gallons in RINs were created through domestic production and net trade, with 4.7 billion in RINs used in meeting the conventional ethanol mandate for 2007. Potential ending stocks for 2007 are then approximately 2.26 billion gallons, with actual ending stocks of 940 million gallons (20% x 4.7 billion gallon mandate).
Table 1 illustrates how the use of banking provisions since 2007 have likely created a total current stock of conventional ethanol RINs totaling approximately 2.5 billion gallons, effectively reducing the 2012 mandate level by the same amount. Note also that the estimated ending stock for conventional RINS has been capped at 20% of the mandate for each year except 2008 when estimated ending stocks were 1.778 billion gallons, or just under the 1.8 billion gallon limit implied by the mandate (20% x 9 billion). The RIN stock estimates reported in table 1 should be interpreted as maximum possible values as they assume all obligated parties have actively managed their RINs, banking as many as possible for application toward the next year’s mandate.
The conventional ethanol mandate for 2012 is set at 13.2 billion gallons, but with an estimated bank of RIN stocks of up to 2.5 billion gallons the effective mandate might be as low as 10.7 billion gallons. The current level of RIN stocks can serve to act as a buffer for the mandate should conditions arise which threaten the economic viability of conventional ethanol production or importing, and ethanol blending. Such conditions would include a short corn crop, or a decline in energy prices for 2012. Thus, while the 13.2 billion gallon mandate implies a revealed demand for corn of approximately 4.7 billion bushels (2.8 gallons per bushel) in 2012, the use of RIN stocks could reduce corn demand for ethanol by as much as 0.9 billion bushels.
Furthermore, the borrowing provision would provide another sizeable buffer, reducing the mandate in any given year by an additional 20%. However, this would most likely require fairly extreme conditions which would force ethanol plants to discontinue production for a significant portion of the year. By borrowing against future time periods, obligated parties are just delaying the fines associated with not meeting their mandates to the next year or betting that 1) economic conditions for ethanol production and blending will improve in the short run, or 2) EPA will provide a waiver to alleviate the cost of meeting the mandate in the next period.
Finally, beyond the impact on effective mandate levels and resulting corn demand for ethanol in future periods, positive RIN stocks also imply low values for separated RIN contracts. Indeed this has been the case for conventional ethanol, with the average trading price of conventional RINs at just $0.016 per gallon in 2010 and $0.005 per gallon in 2011 2. Future posts on the topic of RINs will take a look at their price levels over time and how they might relate to ethanol blending economics and RIN maturities.
References
For more detailed information and background on the RIN system, see:
McPhail, L., Westcott, P., and H. Lutman. 2011. "The Renewable Identification Number System and U.S. Biofuel Mandates." BIO-03, Economic Research Service, United States Department of Agriculture, Washington, DC.
Endnotes
1 Note that this simple example is only used to illustrate. In practice, mandates are applied to individual obligated parties on a percentage of total fuel volume basis. For example, in 2011 all obligated parties were required to use renewable fuels as 8.01% of their total gasoline production and import volumes in meeting the targeted mandate for 2011 of 13.95 billion gallons. See the Renewable Fuel Standard section of the EPA website for more information: http://www.epa.gov/otaq/fuels/renewablefuels/index.htm
2 Based on daily RIN price data in weekly reports from the Oil Price Information Service (OPIS).
Disclaimer: We request all readers, electronic media and others follow our citation guidelines when re-posting articles from farmdoc daily. Guidelines are available here. The farmdoc daily website falls under University of Illinois copyright and intellectual property rights. For a detailed statement, please see the University of Illinois Copyright Information and Policies here.