Biomass-Based Diesel: It’s Still All About the Policy
There is considerable uncertainty about the outlook for biofuels with the changeover of administrations in Washington, D.C. As one example of the uncertainty, the outgoing Biden Administration earlier this month released an “intent to propose” guidance for the new 45Z clean fuel production tax credit, but this does not constitute an official rulemaking, so the status of the 45Z credit is in limbo pending review by the new Trump Administration. The outgoing Biden Administration also delayed proposing the next set of renewable volume obligations (RVOs) for 2026 -2028 under the U.S. Renewable Fuel Standard (RFS) until sometime in 2025. We have previously shown that interactions between different policies in “the policy stack” can produce surprising and poorly understood economic outcomes (farmdoc daily, February 15, 2023). Further, there has been limited discussion of which policies have the most important impacts for biofuel markets. The purpose of this article is to provide further insights about the economic impact of different policies as they impact biomass-based diesel markets. This is the 22nd in a series of farmdoc daily articles related to the renewable diesel boom (see the complete list of articles here).
Analysis
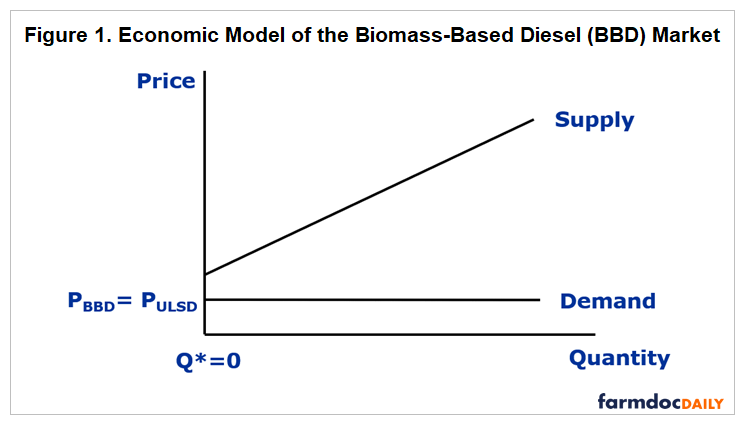
The two main types of biomass-based diesel (BBD) are FAME biodiesel and renewable diesel (farmdoc daily, February 8, 2023). In order to analyze the role of different policies, we use a partial equilibrium economic model of the BBD market that has been used in one form or another in a number of earlier articles on the Renewable Fuel Standard (RFS) and RIN pricing (e.g., farmdoc daily, April 5, 2017; August 23, 2017; February 15, 2023). The model shown in Figure 1 represents the supply of BBD producers and demand from diesel blenders at the wholesale level in a competitive market. Supply and demand of biomass-based diesel is assumed to represent the sum of FAME biodiesel and renewable diesel demand. It is also important to note that supply represents the total of domestic and imported production.
The supply curve in the model shown in Figure 1 is upward sloping to reflect the increasing marginal cost of BBD as quantity supplied increases. Retail domestic demand at the consumer level is implicitly represented by a simple percentage markup of the wholesale blender demand. This implies full pass through of wholesale price changes to the retail level. Note that export demand is assumed to be zero for simplicity. Lastly, we also do not consider the net social benefit of lower greenhouse gas emissions from BBD.
The model in Figure 1 also assumes that BBD blender demand is perfectly elastic (horizontal) at the level of ultra-low sulfur diesel (ULSD) prices. This reflects an assumption that BBD and diesel are perfect blending substitutes (after adjusting for the lower energy value of BBD) and that BBD is a small enough part of the diesel market that changes in the BBD price do not impact the overall blender demand for diesel fuel, including any “rebound” effects (e.g., Lewis, 2016). The implication is that the BBD price must be the same as the ULSD price for there to be a positive BBD demand. If the BBD price is above the ULSD price, then no BBD will be demanded by blenders. While the model is obviously a simplification of the factors that influence the individual supply and demand of FAME biodiesel and renewable diesel, it has proven to be a useful representation of the basic economics of the BBD market.
The most notable feature of the BBD market in Figure 1 is that the equilibrium market quantity (Q*) of BBD is zero. In other words, there is no intersection of the supply and demand curves in the positive quadrant of price and quantity, an unusual outcome reflecting the fact that the production cost of BBD is almost always substantially higher than that of ULSD. This in turn causes the price of BBD to generally exceed that of ULSD by a wide margin. It should be noted that this does not mean there can never be a positive equilibrium quantity of BBD without policy incentives. For example, this could happen if diesel prices are very high and BBD feedstock prices (e.g., soybean oil) are so low that the BBD supply curve is shifted far to the right. The equilibrium portrayed in Figure 1 assumes this is not the norm.
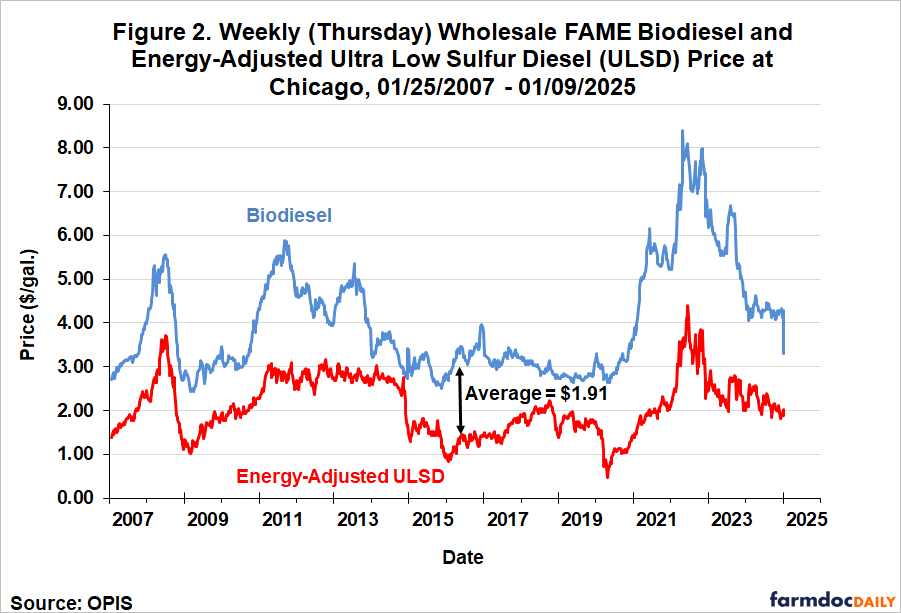
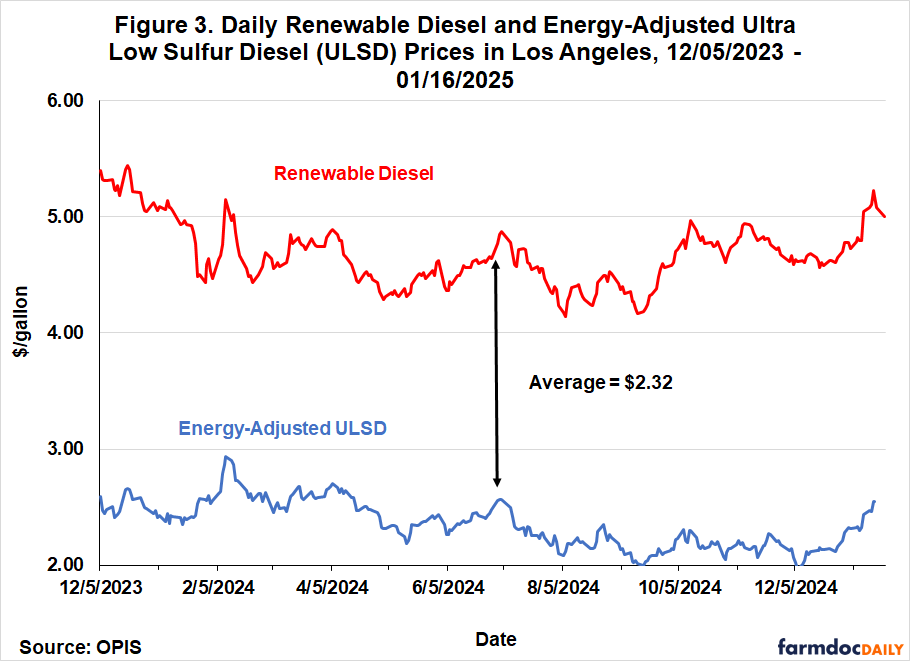
There is ample evidence to justify the assumption that the competitive market equilibrium quantity of BBD is zero because it is relatively costly to produce. Figure 2 shows weekly wholesale prices of FAME biodiesel and energy-adjusted prices of ULSD at Chicago over January 25, 2007 through January 9, 2025. Although there are a few times when biodiesel and ULSD prices are close, there is not a single week where the biodiesel price is below the ULSD price. The difference in prices is normally $1 to $3 per gallon and has ballooned to as large as $5. On average, the biodiesel price over this time period is $1.91 per gallon above the ULSD price. Figure 3 shows daily wholesale prices of renewable diesel and energy-adjusted prices of ULSD at Los Angeles over December 5, 2023 through January 16, 2025. The difference in prices for this shorter sample period averages of $2.32 per gallon, similar to the average difference between FAME and ULSD prices shown in Figure 2. In sum, both FAME biodiesel and renewable prices are, on average, about two times higher than ULSD prices, which demonstrates why little, or no BBD would be produced and consumed without policy incentives.
Given the basic model setup, we can analyze a variety of policy scenarios. We begin in Figure 4 with a volume mandate. Like the U.S. Renewable Fuel Standard (RFS), the mandate is assumed to be a minimum and higher quantities of BBD are theoretically possible if market conditions dictate (e.g., extremely high ULSD prices). In the case analyzed here, the mandate is said to be economically “binding” since the mandated BBD quantity (QM) exceeds the amount of BBD that would be produced in a competitive market equilibrium (zero). To incentivize the mandated higher production, BBD producers must be paid a supply price that is higher than the ULSD demand price. This means that blender demand for BBD effectively becomes perfectly inelastic at the mandated quantity. The entire demand curve becomes L-shaped, with the vertical and perfectly inelastic portion equal to the volume mandate and the horizontal perfectly elastic portion above the mandate equal to the ULSD price. A further, and crucial, implication is that the mandate sets an effective demand ceiling for the domestic BBD market (farmdoc daily, May 31, 2023). The reason that the mandate sets a ceiling is that production greater than the mandate only clears the market if the BBD price is equal to the ULSD price, which would imply massive financial losses for BBD producers. So, in theory we should not observe market production and consumption above the mandate. The BBD industry has struggled to avoid this situation the last two years (farmdoc daily, January 15, 2025). However, it should also be noted that compliance with the RFS mandates is more complicated than assumed here because obligated parties can partially waive obligations each year and carryover credits from year-to-year. This creates some scope for mandate compliance to differ from the assumption implicit here of full compliance every year.
In the equilibrium with a volume mandate shown in Figure 4, the total wholesale cost of BBD to blenders is the area given by PBBD X QM, which can be decomposed into two parts. The first part is the cost of ULSD [PULSD X QM], which is the grey rectangle. This represents the competitive market equilibrium cost of the mandate volume to blenders since it is based on the price of ULSD. The second part is the additional cost to blenders of BBD [(PBBD – PULSD) X QM], represented by the blue rectangle, which is the net cost of imposing the volume mandate. The incremental cost to diesel consumers at the pump is the additional wholesale cost to blenders (blue rectangle) plus a percentage wholesale-retail markup. In this policy scenario, there is no cost to taxpayers.
RINs (Renewable Identification Numbers) play a crucial role in demonstrating compliance with mandates under the RFS. The difference between the supply price (PBBD) and the demand price (PULSD) in Figure 4 is equal to the RIN value. In other words, the economic value of a RIN represents the incentive needed to enforce production and consumption at the mandated volume. Consequently, the additional cost to blenders of mandating BBD in Figure 4 [(PBBD – PULSD) X QM] is equivalent to [(RIN) X QM]. For a detailed discussion of the RIN enforcement mechanism and RIN valuation see this earlier farmdoc daily article (May 24, 2023).
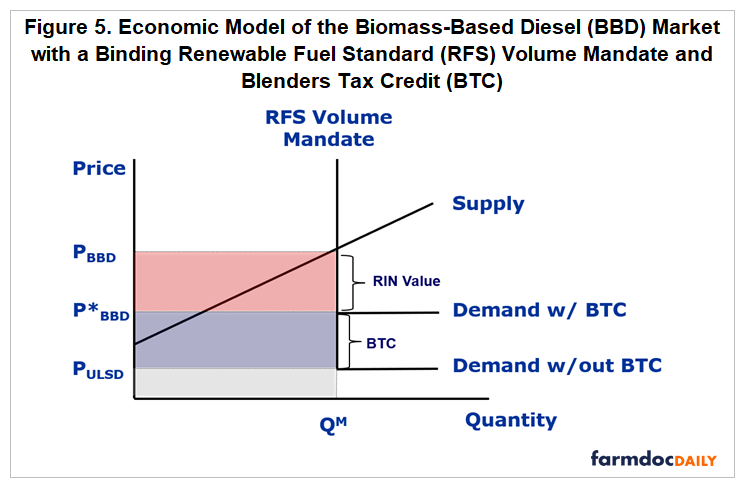
The second policy scenario we consider, shown in Figure 5, is both a volume mandate and a consumption tax credit. This scenario reflects the situation for most of the last 20 years when both the RFS mandate and a $1 per gallon blenders tax credit (BTC) have been in place in the U.S. Both domestic and imported production are assumed to be eligible for the credit, consistent with the specification of the BTC. The mandate is again assumed to be binding because it requires a higher level of production than under a competitive market equilibrium (zero). Notice that the blender demand curve for BBD is kinked as in the previous scenario except the horizontal portion is increased by the amount of the BTC. The effect of the BTC under this scenario is purely distributive because the mandated BBD quantity is unaffected by the tax credit. This has the crucial implication that the demand ceiling implied by the RFS volume mandate is unaffected by the BTC.
In the equilibrium with a volume mandate and BTC shown in Figure 5, the total wholesale cost of BBD to blenders is unchanged and given by the area PBBD X QM. However, the total cost can now be decomposed into three parts. The first part is the cost of ULSD to blenders [PULSD X QM], which is the grey rectangle. The second part is the cost to taxpayers of BBD [(P*BBD – PULSD) X QM], represented by the blue rectangle. The third part is the additional cost to blenders of BBD [(PBBD – P*BBD) X QM], represented by the red rectangle. The total net cost of imposing the volume mandate is equal to the sum of the blue and red rectangles, which is exactly the same as the total net cost when only a mandate is imposed. The difference is that the net cost is now distributed between taxpayers and blenders. The incremental cost to diesel consumers at the pump is the additional wholesale cost to blenders (red rectangle) plus a percentage wholesale-retail markup. As always, the RIN value in Figure 5 is given by the difference between the supply price and the demand price. This value is reduced to PBBD – P*BBD because of the impact on demand of the BTC.
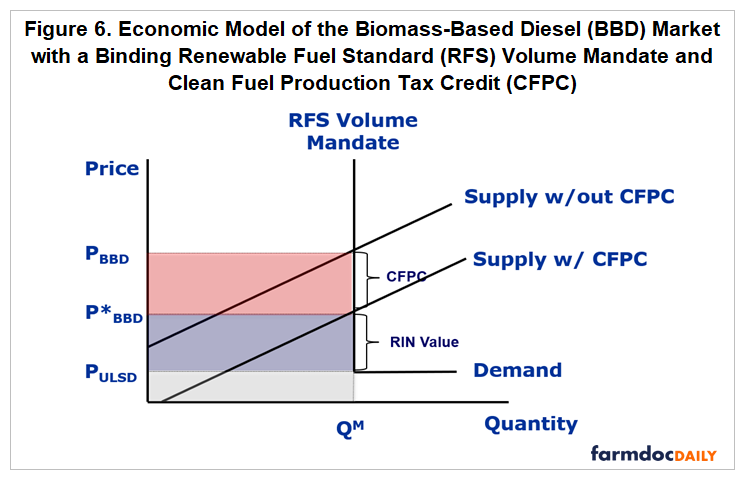
The third policy scenario we consider, shown in Figure 6, is a binding volume mandate and a production tax credit. This scenario is meant to represent the new 45Z clean fuel production tax credit (CFPC) that is scheduled to go into effect this year and replace the BTC. The CFPC is not a fixed dollar credit like the BTC but is keyed to the carbon intensity (CI) score of biofuels. We simplify the analysis here by considering a fixed dollar CFPC equal to the old $1 per gallon PTC. We also allow both domestic production and imports to be eligible for the CFPC for simplicity. Only domestic production is eligible for the new 45Z CFPC. We will discuss later the implications of relaxing these two assumptions.
The mandate is again assumed to be binding in Figure 6 because it requires a higher level of production than under a competitive market equilibrium (zero). Since the CFPC is a producer tax credit, it shifts the supply curve downward rather than shifting the demand curve upward as with the BTC. The effect of the CFPC under this scenario is purely distributive because the mandated BBD quantity is unaffected by the tax credit. This once again has the crucial implication that the demand ceiling implied by the RFS volume mandate is unaffected by the CFPC.
In the equilibrium with a volume mandate and CFPC shown in Figure 6, the total wholesale cost of BBD to blenders is unchanged and given by the area PBBD X QM. The total cost can be decomposed again into three parts. The first part is the cost of ULSD [PULSD X QM], which is the grey rectangle. The second part is the additional cost to blenders of BBD [(P*BBD – PULSD) X QM], represented by the blue rectangle. The third part is the cost to taxpayers of BBD [(PBBD – P*BBD) X QM], represented by the red rectangle. The total cost of imposing the volume mandate is equal to the sum of the blue and red rectangles, which is the same as the total net cost in the previous two scenarios, with the only difference that the cost to taxpayers and consumers is flipped between the BTC and CFPC. The incremental cost to diesel consumers at the pump is the additional wholesale cost to blenders (blue rectangle) plus a percentage wholesale-retail markup. The RIN value under the CFPC is P*BBD – PULSD compared to PBBD – P*BBD under the BTC.
As discussed above, the scenario analyzed in Figure 6 assumed the CFPC was a fixed $1 per gallon and applied to both domestic production and imports. The new 45Z version of the CFPC is keyed to the CI score of various biofuels, including BBD, and only domestic production is eligible. The impact of the CI scoring is likely to mean that the 45Z CFPC will be smaller than $1 per gallon for BBD (e.g., Buffie, 2023), which would imply a smaller downward shift in the supply curve compared to that shown in Figure 6. In addition, the reduction in imports due to their higher cost in the absence of the CFPC for these quantities would result in an even smaller downward shift in the supply curve. The smaller net downward shift in the supply curve would decrease costs of taxpayers and increase the costs of blenders (and implicitly consumers). However, these changes are purely distributive because the mandated BBD quantity is unaffected, and the crucial implication follows that the demand ceiling implied by the RFS volume mandate is unaffected.
It should be emphasized that the framework used in this article can be used to examine the economic impact of other policies, such as credits from the Low Carbon Fuel Programs in states such as California, Oregon, and Washington, import tariffs and quotas, and state mandates and sales tax incentives for BBD. While the analysis of these other policies is certainly interesting, the impacts are likely to be distributive similar to the BTC and LCFC. Finally, the lack of impact on mandated BBD quantity does not necessarily preclude tax credits from having other important impacts, such as the types of feedstocks used to produce BBD or the split between domestic production versus imports.
Implications
The biomass-based diesel (BBD) market is best understood as a “policy market” because no BBD would be produced or consumed in the U.S. without policy incentives. Since the BBD market (FAME biodiesel + renewable diesel) is fundamentally dependent on policy, understanding the economic impact of different policies is paramount. This is especially important at the present time because there is considerable uncertainty about the direction of several key policies related to BBD. In this article, we use a simple model of the BBD market to illustrate the economic impact of a volume mandate under the U.S. Renewable Fuel Standard (RFS), a blenders tax credit (BTC), and a clean fuels production tax credit (CFPC). The most important result of the analysis is that a binding RFS volume mandate takes precedence over both the BTC and CFPC in terms of economic impact. More specifically, the impact of both the BTC and CFPC are purely distributive because the mandated BBD quantity is unaffected by the credits. In other words, the BTC and CFPC only alter who pays the cost of incentivizing BBD production and consumption at the mandated level, not the level of the mandates. This has the crucial implication that the demand ceiling implied by the RFS volume mandates is unaffected by the either the BTC or the CFPC. From a practical perspective, the level of RFS mandates is by far the most important determinant of the outlook for the BBD sector.
References
Buffie, N. “The Section 45Z Clean Fuel Production Credit.” In Focus, Congressional Research Service, September 27, 2023. https://crsreports.congress.gov/product/pdf/IF/IF12502
Gerveni, M., T. Hubbs, S. Irwin and S. Ramsey. "Revisiting the RIN Cliff." farmdoc daily (15):10, Department of Agricultural and Consumer Economics, University of Illinois at Urbana-Champaign, January 15, 2025.
Gerveni, M., T. Hubbs and S. Irwin. "Is the U.S. Renewable Fuel Standard in Danger of Going Over a RIN Cliff?" farmdoc daily (13):99, Department of Agricultural and Consumer Economics, University of Illinois at Urbana-Champaign, May 31, 2023.
Gerveni, M., T. Hubbs and S. Irwin. "Overview of the RIN Compliance System and Pricing of RINs for the U.S. Renewable Fuel Standard." farmdoc daily (13):95, Department of Agricultural and Consumer Economics, University of Illinois at Urbana-Champaign, May 24, 2023.
Gerveni, M., T. Hubbs and S. Irwin. "Biodiesel and Renewable Diesel: It’s All About the Policy." farmdoc daily (13):27, Department of Agricultural and Consumer Economics, University of Illinois at Urbana-Champaign, February 15, 2023.
Gerveni, M., T. Hubbs and S. Irwin. "Biodiesel and Renewable Diesel: What’s the Difference?" farmdoc daily (13):22, Department of Agricultural and Consumer Economics, University of Illinois at Urbana-Champaign, February 8, 2023.
Irwin, S. "Blender and Producer Sharing of Retroactively Reinstated Biodiesel Tax Credits: Time for a Change?" farmdoc daily (7):62, Department of Agricultural and Consumer Economics, University of Illinois at Urbana-Champaign, April 5, 2017.
Irwin, S. and D. Good. "How to Think About Biodiesel RINs Prices under Different Policies." farmdoc daily (7):154, Department of Agricultural and Consumer Economics, University of Illinois at Urbana-Champaign, August 23, 2017.
Lewis, J. “The RFS, the Rebound Effect, and an Additional 431 Million Tons of CO2.” Clean Air Task Force, September 13, 2016. https://www.catf.us/2016/09/the-rfs-the-rebound-effect-and-an-additional-431-million-tons-of-co2/
Disclaimer: We request all readers, electronic media and others follow our citation guidelines when re-posting articles from farmdoc daily. Guidelines are available here. The farmdoc daily website falls under University of Illinois copyright and intellectual property rights. For a detailed statement, please see the University of Illinois Copyright Information and Policies here.


