


2024 NASS County Corn and Soybean Yields
The National Agricultural Statistics Service (NASS) of the USDA recently released 2024 county yield estimates for corn and soybeans. Following typical patterns, corn and soybean yields were highest in the Midwest Corn Belt region and south into the Mississippi Delta region. While NASS yields are not the primary source used to determine ARC-CO payments, they can be used with current MYA price projections to estimate potential ARC-CO payments for 2024. Given that MYA prices are expected to be slightly more than 10% below the respective ARC benchmarks for corn and soybeans, ARC-CO payments could be triggered in a number of areas where yields are below the county’s benchmark yield.
2024 NASS County Corn Yields
Estimates of county corn yields reported by NASS for 2024 are shown in Figure 1. Counties with a NASS corn yield below the US average of 179.3 bushels per acre for 2024 are shown in yellow, orange, and red. Counties with average yield estimates exceeding the national average are shown in shades of green.
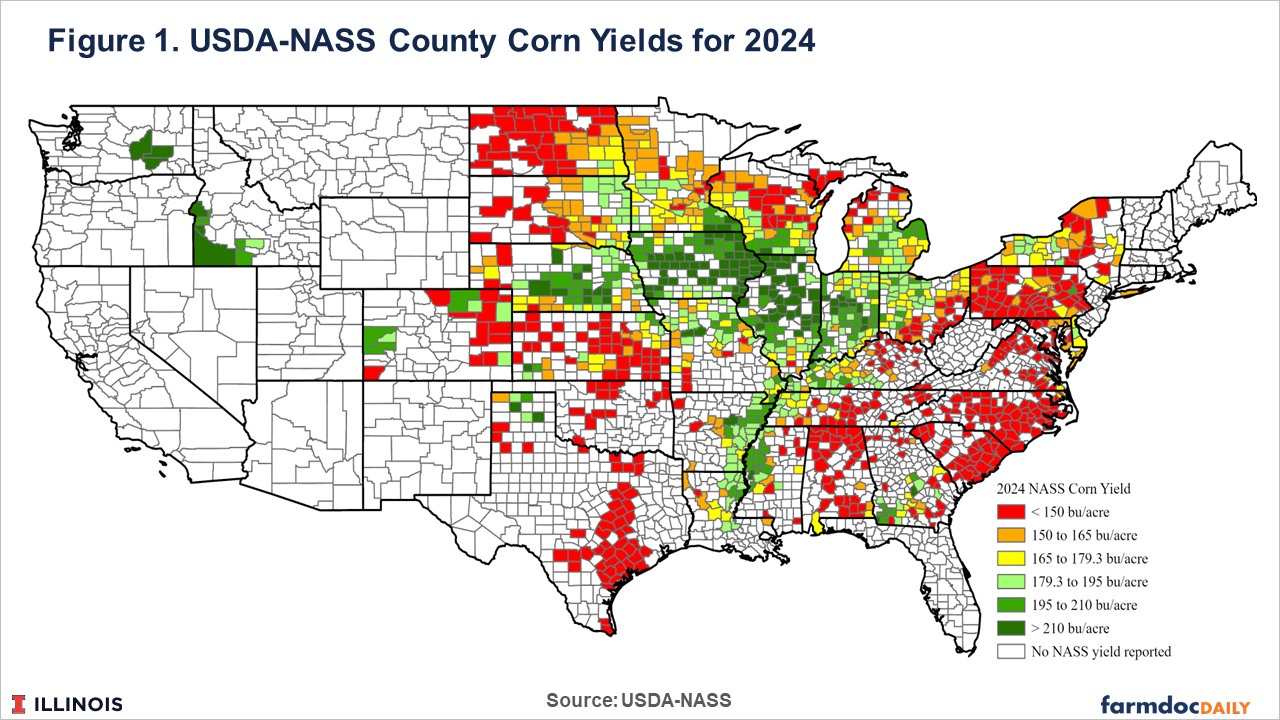
Counties with yields above the US average yield occurred in the typical regions. Most counties in Iowa, Illinois and Indiana – the heart of the US Corn Belt region – had yields above the U.S. average. Higher yields were also common in counties bordering the I-States, including the eastern two-thirds of Nebraska, southeastern Minnesota, southern Wisconsin, areas of southern Michigan, western Ohio and Kentucky, and northern Missouri. Above average corn yields also occurred in the Mississippi Delta region including the boot heel of Missouri, eastern Arkansas and Louisiana, and western Mississippi and Tennessee.
Corn yields below the national average occurred in the western Dakotas, northern portions of the Lake States, Texas, Oklahoma, and most states in the eastern and southeastern US.
NASS yields provide the first county-level estimates available for the 2024 crop year. The Farm Service Agency (FSA) will make their own county yield estimates to determine ARC-CO payments for 2024 once the marketing year ends in August. The 2018 Farm Bill prioritized the use of county yields from the Risk Management Agency (RMA) based on crop insurance data (see farmdoc daily from October 20, 2020). NASS yields do however play a supplementary and advisory role. Yields used by FSA in calculating ARC-CO payment yields can vary substantially from NASS yields (see farmdoc daily articles from November 2, 2017 and February 25, 2020), so we caution readers in how they interpret the likelihood of ARC-CO payments in their area based on what the NASS yields suggest.
Still, the NASS yields, combined with current market year average price projections, provide some indication of where payments might occur. The latest estimate of the 2024 MYA price for corn from the May WASDE is $4.35 per bushel, which is just over 10% below the ARC-CO benchmark price of $4.85 for 2024 (4.35/4.85 = 0.897, a 10.3% price loss). Given ARC-CO’s revenue trigger of 86%, the yield for a county must be below 96% of the county’s benchmark yield for ARC-CO payments to occur (0.86/0.897 = 0.959 or 96%). Yields at or below 85% of the county’s benchmark would trigger the maximum ARC-CO payment of 10% of benchmark revenue.
Figure 2 illustrates where ARC-CO payments for corn base acres might be likely to occur for 2024. Counties in green have a NASS yield greater than 96% of the ARC-CO benchmark yield, which would result in no payment. Counties in yellow have NASS yields between 85% and 96% of the benchmark, suggesting a payment could be triggered for ARC-CO. Counties in red have a reported NASS yield that is less than 85% of the county benchmark, which implies the maximum ARC-CO payment could be triggered. Since NASS does not distinguish between irrigated or non-irrigated practices in the yields they report, we compare them with the ARC-CO benchmark yields for “non-irrigated” or “all” practices.
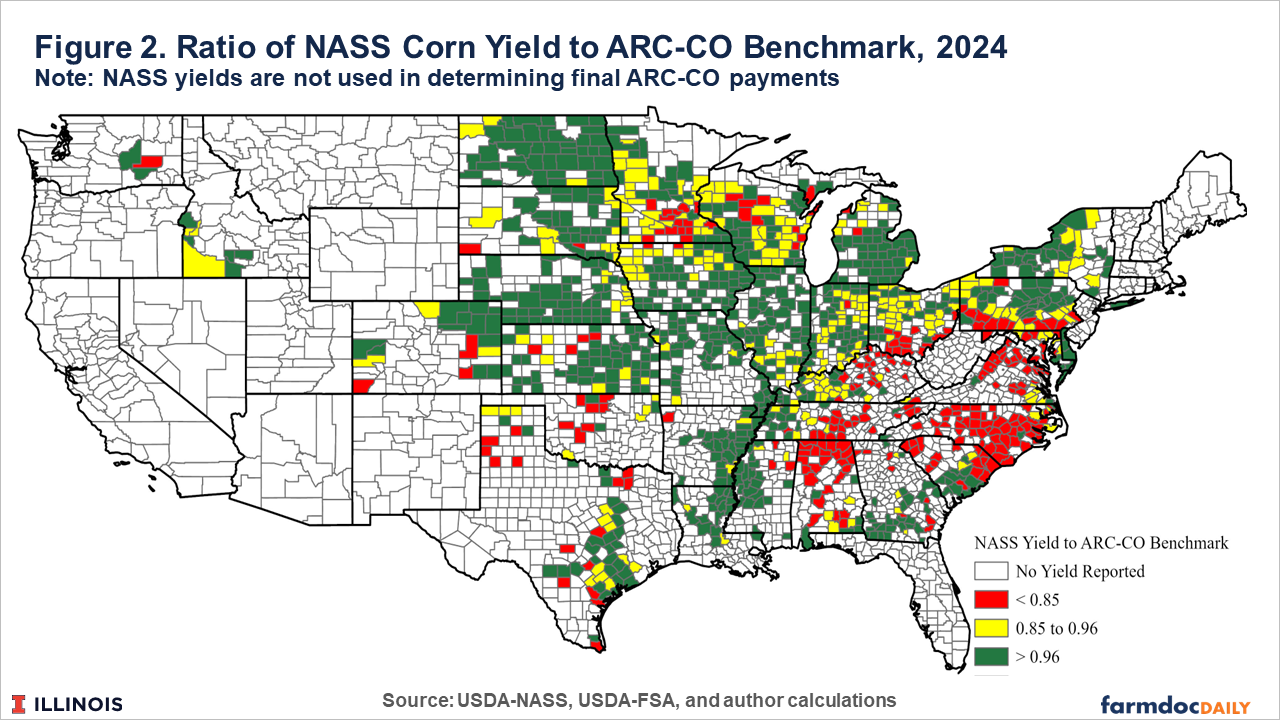
NASS yields suggest ARC-CO payments could be triggered in some counties across all US states for 2024. Of the 1,272 counties with a NASS yield estimate, 64% could have average county yields low enough to trigger an ARC-CO payment and 38% could have sufficient yield losses to trigger the maximum ARC-CO payment.
2024 NASS County Soybean Yields
Estimates of county soybean yields reported by NASS for 2024 are shown in Figure 3. Counties with a NASS soybean yield below the US average of 50.7 bushels per acre for 2024 are shown in yellow, orange, and red. Counties with average yield estimates exceeding the national average are shown in shades of green.
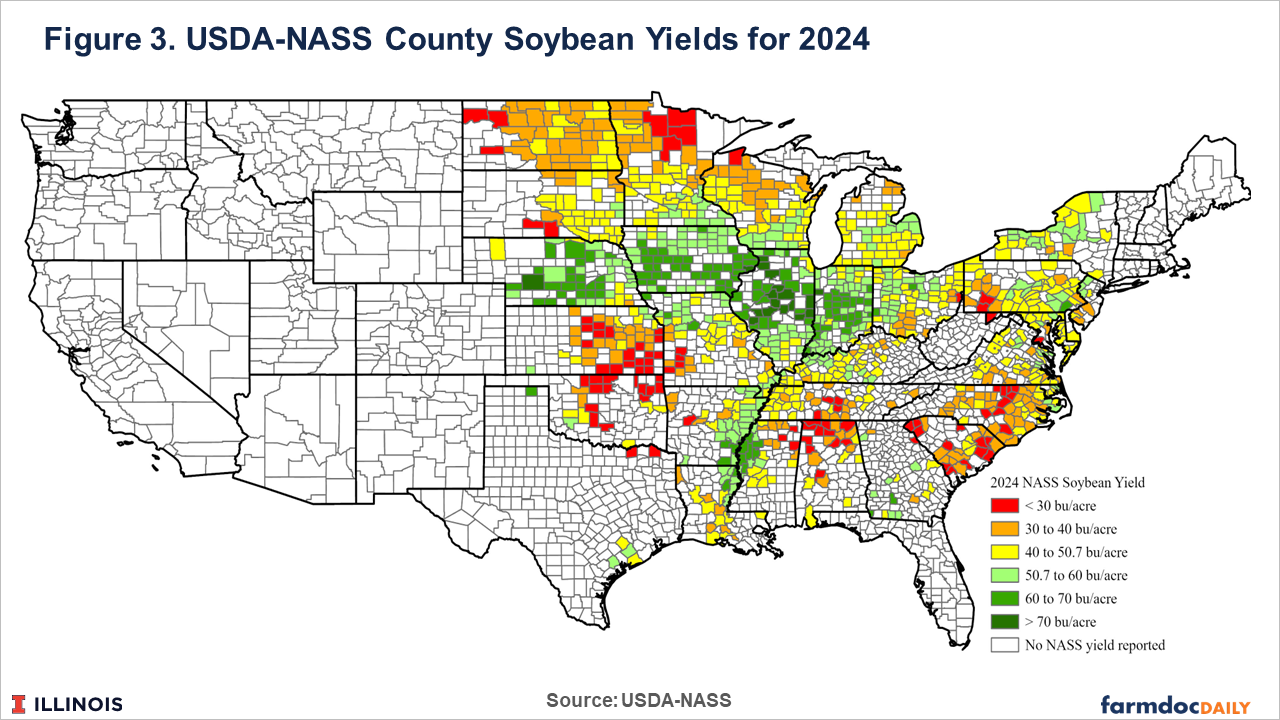
Similar to corn, soybean yields above the US average yield occurred in most counties throughout the main Corn Belt region, including Iowa, Illinois, Indiana and bordering regions of the surrounding states, and in the Mississippi Delta region counties. Yields below the US average were reported in other soybean production regions of the US for 2024.
The May WASDE projects the 2024 MYA price for soybeans at $9.95 per bushel, a little more than 10% below the ARC benchmark price of $11.12 (9.95/11.12 = 0.895, a 10.5% price loss). At this price level, the relative yield triggers would be roughly the same for soybeans as for corn – yields below 96% of the county benchmark would trigger ARC-CO payments and yields more than 85% below the benchmark would trigger the county’s max ARC-CO payment. Figure 4 shows the ratio of the NASS yield estimates to each county’s respective ARC-CO benchmark yield for soybeans.
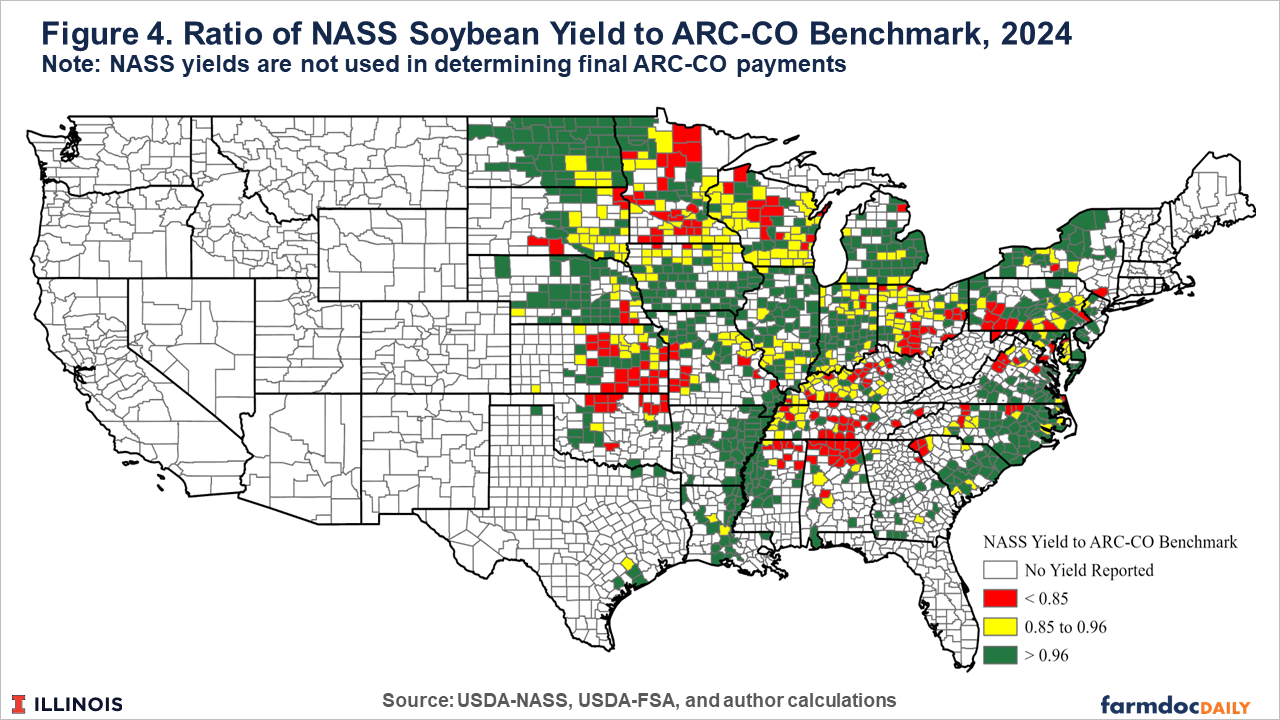
As with the yield ratio map for corn (Figure 2), counties in green are not likely to trigger ARC-CO payments based on reported NASS yields. Counties in yellow could trigger ARC-CO payments for soybean base acres in 2024, and counties in red would be more likely to trigger maximum ARC-CO payments. ARC-CO payments for soybean base acres seem likely to be triggered in a number of counties across all US states for 2024. Of the 1,123 counties with a NASS soybean yield estimate, 59% have yields low enough to trigger an ARC-CO payment and county yield losses are sufficient to trigger the maximum ARC-CO payment in 33% of the counties.
Summary
Recently released USDA-NASS estimates of 2024 county yields suggest that ARC-CO payments for corn and soybean base acres could be triggered for a majority of US counties, with a third of counties close to or near the maximum ARC-CO payment per base acre.
We want to emphasize that the NASS yields are not what will be used to determine final ARC-CO payments. More county yield information will become available in June when the Risk Management agency releases their county yields used for area insurance programs. FSA will then follow its process to determine the ARC-CO county yield used to determine ARC-CO payment. Therefore, these estimates are preliminary. Moreover, the final MYA price for 2024 will not be known until the marketing year ends on August 31. The yields, prices, and final payment rates for ARC-CO will not be released until later in September after the marketing year ends.
References
Paulson, N., G. Schnitkey, J. Coppess, K. Swanson and C. Zulauf. "Adjusting NASS County Yields to Estimate 2019 ARC-CO Payments." farmdoc daily (10):34, Department of Agricultural and Consumer Economics, University of Illinois at Urbana-Champaign, February 25, 2020.
Schnitkey, G., C. Zulauf, N. Paulson, K. Swanson and J. Coppess. "Understanding FSA Yields Used to Calculate 2019 ARC-CO Payments." farmdoc daily (10):186, Department of Agricultural and Consumer Economics, University of Illinois at Urbana-Champaign, October 20, 2020.
USDA-NASS. Quickstats Database. https://quickstats.nass.usda.gov/
USDA-FSA. ARC and PLC Data. https://www.fsa.usda.gov/resources/programs/arc-plc/program-data
USDA. Office of the Chief Economist, World Agricultural Outlook Board, World Agricultural Supply and Demand Estimates. https://www.usda.gov/about-usda/general-information/staff-offices/office-chief-economist/commodity-markets/wasde-report
Zulauf, C., G. Schnitkey, N. Paulson and J. Coppess. "Comparing NASS and RMA County Yields for Corn." farmdoc daily (7):202, Department of Agricultural and Consumer Economics, University of Illinois at Urbana-Champaign, November 2, 2017.
Disclaimer: We request all readers, electronic media and others follow our citation guidelines when re-posting articles from farmdoc daily. Guidelines are available here. The farmdoc daily website falls under University of Illinois copyright and intellectual property rights. For a detailed statement, please see the University of Illinois Copyright Information and Policies here.