


Grains and Oilseeds: Part 2 – United States
Since 1980, US exports of grains and oilseeds have grown, but at a slower rate than US domestic consumption, resulting in a declining relative role of exports in the US grain-oilseed sector. The decline reflects many factors, including higher per capita income, which has increased consumption of animal protein, and the longstanding US goal of energy self-sufficiency. It is also consistent with US domestic demand being a more certain demand expansion path than exports for US farm policy advocates given that the US has taken a variety of international trade actions over time that have negatively impacted grain and oilseed exports (see farmdoc daily, July 13, 2018).
Data and Procedures
This study examines production, domestic consumption, and exports of grains and oilseeds in the US since 1980 as reported in the Production, Supply, and Distribution Online (PSD) database (U.S. Department of Agriculture, Foreign Agriculture Service). Domestic consumption is the quantity consumed by a country from domestic production and imports. To maintain comparability with the analysis of grains and oilseeds in South America and China published on August 22, 2025 in farmdoc daily, this study starts with the 1981/1982 crop year (hereafter, only the first year is used). Grains and oilseeds in this study include feed grains (barley, corn, millet, oats, sorghum), food grains (rice, rye, wheat), and oilseeds (cottonseed, peanuts, rapeseed, soybeans, sunflowers). These 13 crops should be considered collectively since they compete for acres and are demand substitutes and complements. Since the weight per unit differs by crop, the unit of measurement is metric ton.
US – Declining Relative Role for Exports
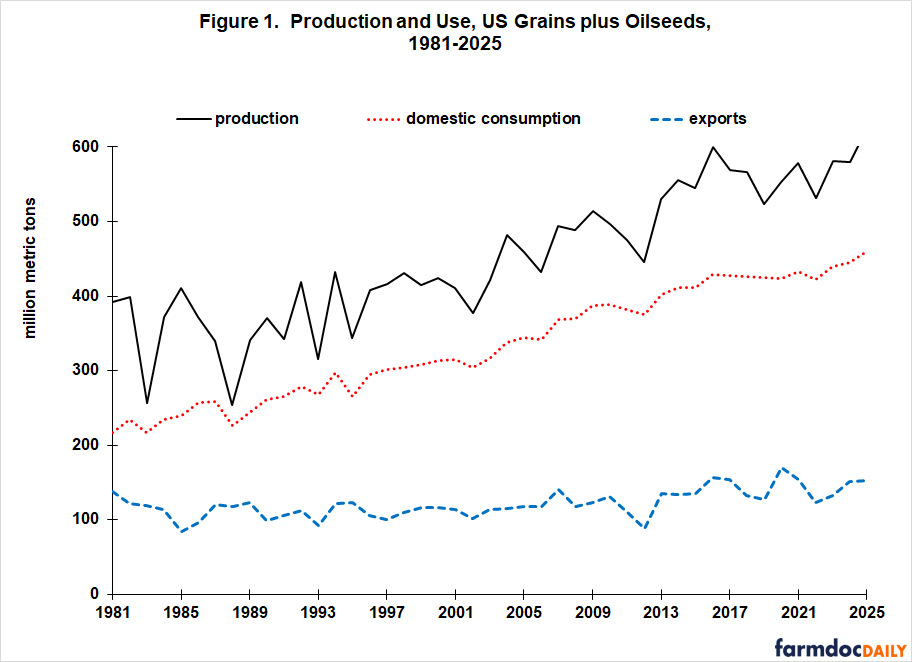
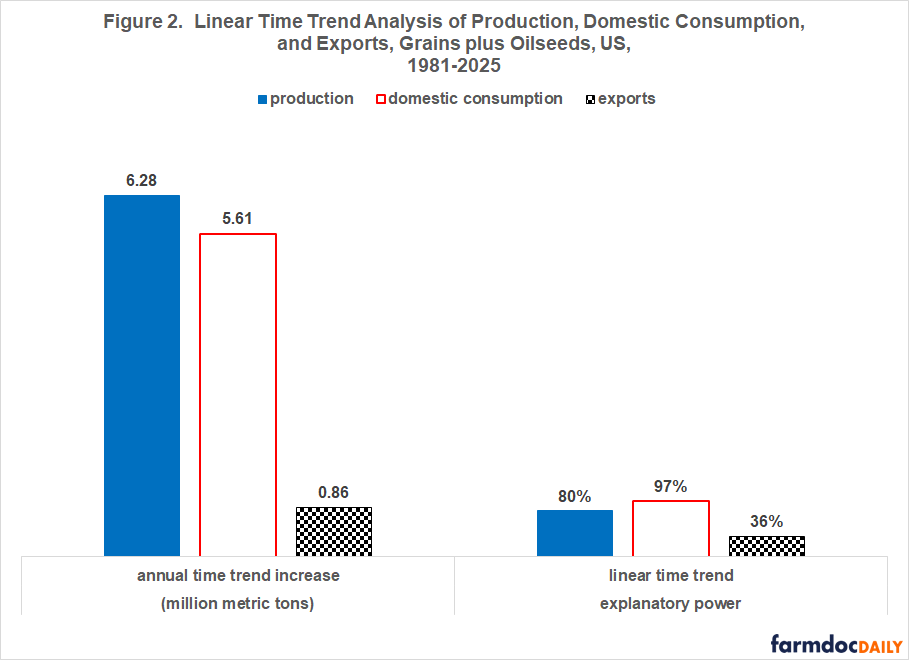
US exports, domestic consumption, and production of combined grains plus oilseeds are, respectively, 24%, 93%, and 58% higher in 2021-2025 than in 1981-1985 (see Figure 1). The linear trend increase is, respectively, 0.9, 5.6, and 6.3 million metric tons per year since 1980 (see Figure 2). Explanatory power of the linear time trend is 36% for exports, 97% for domestic consumption, and 80% for production. Each linear trend relationship is significant at 99% statistical confidence. Because US domestic consumption has increased more than US exports, export share of US domestic consumption plus exports has declined from 33.5% in 1981-1985 to 24.5% in 2021-2025.
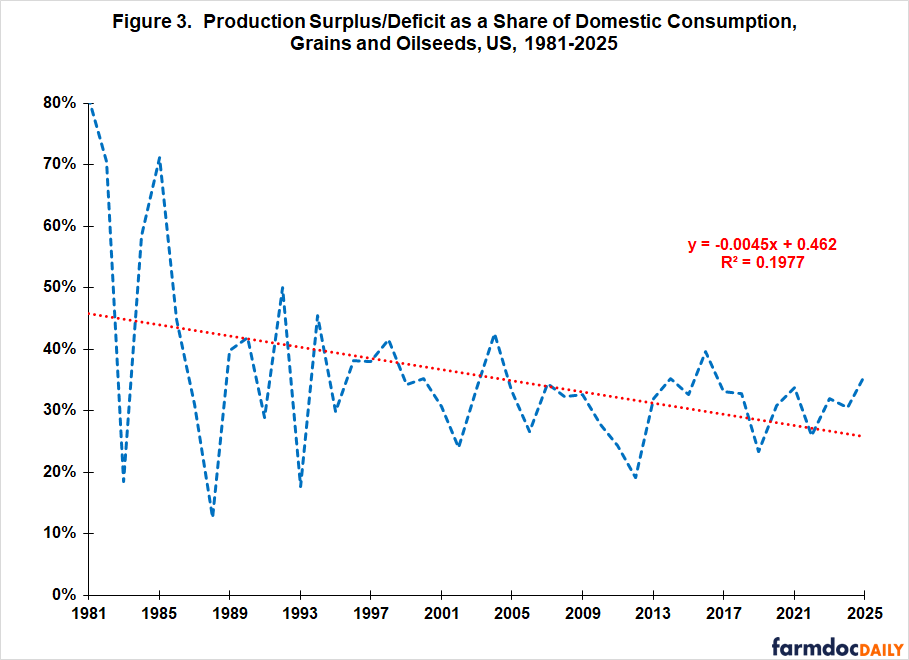
US Annual Production Surplus
To further examine the dynamics of the US grain-oilseed market, the annual difference between production and domestic consumption as a share of domestic consumption is calculated. The difference between production and domestic consumption will primarily end up as exports or ending stocks. Unsurprisingly given Figure 1, the US production surplus above domestic consumption as a share of domestic consumption has declined (see Figure 3). The rate of annual decline is 0.45 percentage point per year. Annual US production surplus over domestic consumption averaged 32% in 2021-2025 vs. 60% in 1981-1985. However, US production has never been below US domestic consumption. The smallest production surplus over domestic consumption was 14% in the major drought year of 1988. Three other years were also below 20%: 1983 and 2012, both major drought years, and 1993, when extended cloudy, wet weather negatively impacted US production.
Impact on US Price
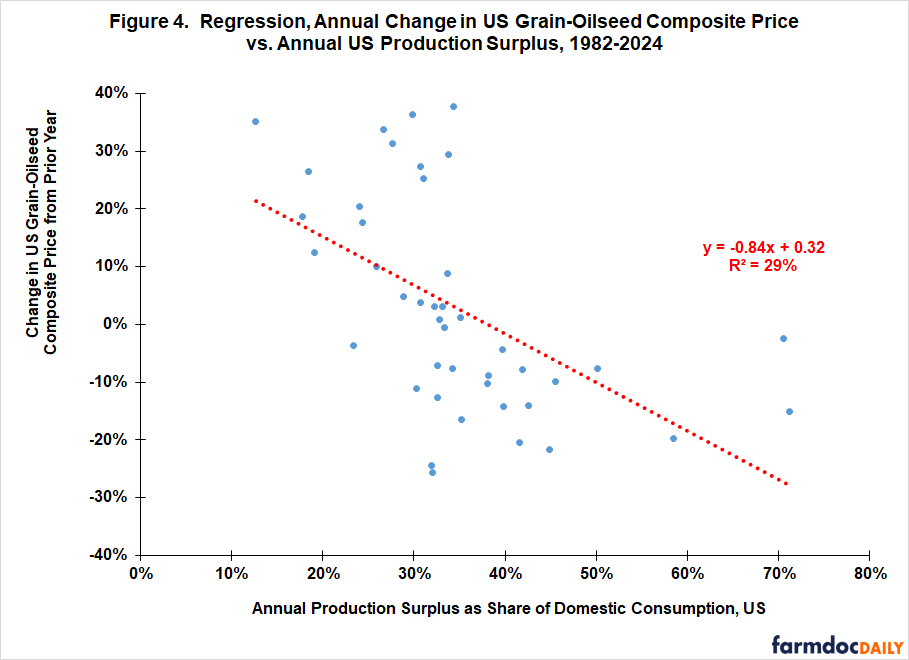
A regression analysis is conducted to estimate the ability of the annual US production surplus as a share of domestic consumption to explain the percent change in the US grain-oilseed composite price from the prior year. To illustrate these variables, the regression data set contains a dependent variable showing a -2.4% change in the US grain-oilseed composite price from the 1981 to 1982 crop years, paired with an explanatory variable of an 81% ratio of US production surplus to domestic consumption for the 1982 crop year. Construction of the grain-oilseed composite price is discussed in the Data Note.
US annual percent production surplus over domestic consumption explained 29% of the year-to-year percent change in the US grain-oilseed composite price (see Figure 4). Statistical confidence is 99%. In comparison, annual percent production surplus/deficit of South America plus China explained only 5% of the percent change in this US price and was not statistically significant (see farmdoc daily, August 22, 2025).
Discussion
Although the US has consistently been an exporter of grain and oilseeds over the last 45 years, the role of exports in the US grain-oilseed sector has steadily declined as US exports have grown slower than US domestic consumption.
Expanding US domestic consumption of grains and oilseeds reflects many factors, including higher per capita income, thus consumption of animal protein, as well as the US’s longstanding goal of energy self-sufficiency. It is also consistent with the counter-response of the US field crop sector to using embargos and other international trade restrictions that negatively impact US exports as instruments of US foreign policy. In short, growing US domestic demand is a more certain demand expansion path for US farm policy advocates than is growing US exports.
US farm bills in the 21st Century have contained an agricultural trade title. It has funded a variety of trade promotion programs (see US Congressional Research Service, updated June 18, 2025). Moreover, the 2025 Reconciliation Farm Bill created a new agricultural trade promotion program, the Supplemental Trade Promotion Program. Its authorized budget baseline is $285 million per year through Fiscal Year 2036 (see US Congressional Research Service, updated June 25, 2025).
These legislative efforts are an indication of continuing US interest in promoting agricultural exports. But, it is also important to point out that they impact demand for US grains and oilseeds far less than the various US biofuels mandates. This policy difference, in effect, both creates and reflects the different increase in US grain-oilseed domestic consumption and exports since 1980 (93% vs. 24%).
The annual US production surplus over domestic consumption explained a statistically significant 29% of the variation in the year-to-year percent change of the US grain-oilseed composite price. This share is a relatively high single variable explanation of a variable measured in percent change, but it also means that a large share of the yearly percent change in the US grain-oilseed composite price is explained by other variables.
The next article in this series will examine trends in the grain-oilseed production surplus for the rest of the world excluding the US, South America, and China. The last article in this series will use regression analysis to assess the relative ability of US, South America-China, and the rest of the world production surpluses/deficits to explain yearly changes in the US grain-oilseed composite price.
Data Note
The US composite price index for the grains and oilseeds in this study was calculated as follows. First, each grain and oilseed’s US average price for the 1981-2024 market years was obtained from the QuickStats database maintained by the US Department of Agriculture, National Agricultural Statistics Service. Second, all per bushel prices were converted to price per pound using the crop’s standard pounds per bushel conversion factor. Third, each crop’s price per pound was weighted by the crop’s share of total US grain and oilseed production for the year. Fourth, the weighted prices were summed across the crops. This sum was the US grain-oilseed composite price for the market year.
References and Data Sources
US Congressional Research Service. “Farm Bill Primer: Trade and Export Promotion Programs.” In Focus. Updated June 18, 2025. https://www.congress.gov/crs-product/IF12155.
US Congressional Research Service. “Budget Reconciliation: Farm Bill Programs Without a Budget Baseline and Trade Promotion, Research, Horticulture, and Animal Health Programs with a Budget Baseline.” Insight. Updated June 26, 2025. https://www.congress.gov/crs-product/IN12573.
US Department of Agriculture, National Agricultural Statistics Service. August 2025. QuickStats. https://quickstats.nass.usda.gov/
US Department of Agriculture, Foreign Agriculture Service. August 2025. Production, Supply, and Distribution Online. https://apps.fas.usda.gov/psdonline/
Zulauf, C., J. Coppess, N. Paulson and G. Schnitkey. “U.S. Corn, Soybean, Wheat Exports and USSR Grain Embargo: Contemporary Implications.” farmdoc daily (8):129, Department of Agricultural and Consumer Economics, University of Illinois at Urbana-Champaign, July 13, 2018.
Zulauf, C., G. Schnitkey, N. Paulson and J. Colussi. “Grains and Oilseeds: Part I – China and South America.” farmdoc daily (15):153, Department of Agricultural and Consumer Economics, University of Illinois at Urbana-Champaign, August 22, 2025.
Disclaimer: We request all readers, electronic media and others follow our citation guidelines when re-posting articles from farmdoc daily. Guidelines are available here. The farmdoc daily website falls under University of Illinois copyright and intellectual property rights. For a detailed statement, please see the University of Illinois Copyright Information and Policies here.