


Comparing Returns to Owned vs Cash Rented Farmland
Recent projections for the 2026 crop year suggest a fourth consecutive year of negative farmer returns to corn-soybean rotations in Illinois on cash rented farmland (see farmdoc daily article from August 19, 2025). Land costs have increased over time for both owned and cash rented farmland situations. The current return for owned and cash rented farmland is the same. Farmland ownership has also provided capital returns through increased farmland values. Low farmer returns from cash rent farmland relative to land prices make it difficult for farmers to use rented farmland to build capital to support a farmland purchase. Traditional policy responses, such as increased government payments, may be limited in their effectiveness to the extent that they continue to support larger production cost and land value increases than would otherwise occur in their absence.
Farmland Ownership vs Cash Renting
We consider two scenarios through which a farm operator, or farmer, might control a piece of farmland: 1) owning the farmland, or an owner-operator situation, and 2) cash renting the farmland. Data from the USDA indicates that the majority of cropland in the U.S. is rented, with higher rates of farmland rental in the Corn Belt region and among larger farm operations. For grain farms enrolled in Illinois Farm Business Farm Management (FBFM), less than 25% of the land is owned by the farm operation on average, and cash rent arrangements account for most of the rented acres (see farmdoc daily article from July 19, 2024). Over time, the share of land cash rented has increased while farmer ownership rates have been stable to declining.
In both situations, the farmer is paying the non-land production costs and receiving the crop and other revenues, such as government payments, and taking on the associated production and financial risks. The annual land costs associated with ownership and cash rent situations can vary greatly from farm to farm. In general, they include:
Farm Ownership Costs
- Real estate taxes
- Maintenance and improvement costs. Examples include, but are not limited to, mowing and other maintenance of fence lines and ditches, as well as multi-year investments in drainage tile or soil fertility.
- Financing and opportunity costs. Interest payments on debt financed farmland impact income or returns and cash flows, while principal repayment impacts cash flows. Debt repayment varies considerably across farms based on the structure and terms of the farmland debt. An economic opportunity cost should be considered for equity financed farmland to account for alternative uses.
Cash Rent Costs
- Annual cash rental payment. This might be a fixed amount or vary with market indicators (i.e. a variable or hybrid cash rent)
- In some cases, tenants may contribute towards some of the maintenance and improvement costs outlined above.
The current net farmer return in both cases equals total revenues minus non-land costs (a measure referred to as the operator and land return in farmdoc crop budgets) and land costs, or total revenues minus total costs. In addition to the current return, farmland owners earn a capital return due to changes in the value of the farmland asset. This capital return could be positive or negative over any given time period. While the capital return is only realized if the ownership of the asset changes via sale or other form of transfer, it impacts the financial position of the farm business via net worth.
Average cash rents on grain farms enrolled in FBFM in central Illinois increased from $132 per cash rented acre in 2000 to $336 in 2024, or an average increase of 4% each year. The time path of average cash rental rate increases has varied since 2000. Faster increases have occurred during periods of higher return levels, as illustrated in Figure 1 by comparing with the operator and land return series. Operator and land returns include all crop revenues, including government payments, and non-land production costs. High return periods include the years during the expansion of the domestic ethanol industry and growth in export market demand from around 2006 to 2013 and in the more recent high return period from 2020 through 2022. Average cash rents stabilize or have even declined slightly during lower return periods such as the early 2000s (and, though not shown, the late 1990s) and the period from 2014 to 2019. Average cash rent levels in central Illinois declined from 2023 to 2024, with additional small reductions projected for 2025 and 2026 due to the current period of lower returns.
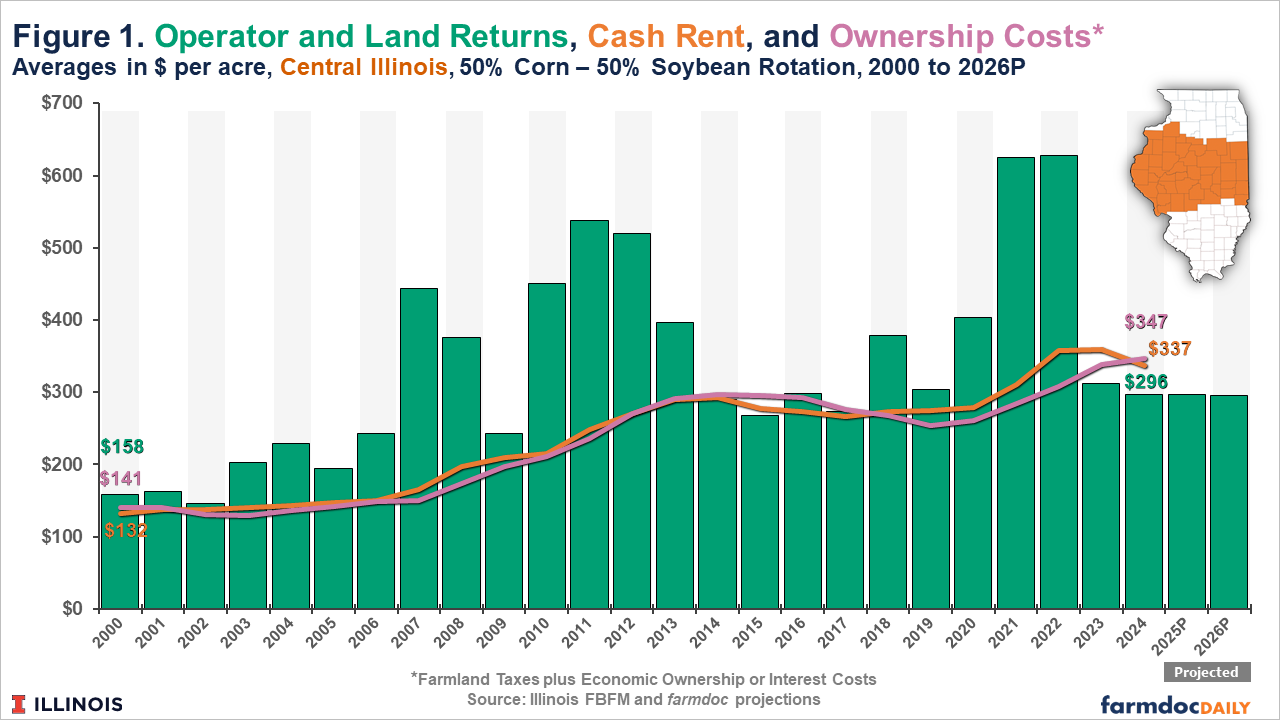
Average farmland taxes paid by FBFM grain farms in central Illinois have increased from $33 per owned acre in 2000 to nearly $76 per owned acre in 2024, an average annual increase of 3.5%. Real estate taxes on farmland have followed a steadier path of growth over time. Average per acre real estate taxes were relatively stable from 2000 to 2009 and have since increased at a near linear rate.
Economic ownership or interest costs on owned land are calculated by FBFM as the product of current farmland value times a capitalization rate that is based on a rolling-average of net farmer returns. Average economic ownership or interest costs on farmland in central Illinois have increased from $108 per owned acre in 2000 to over $270 per owned acre in 2024, an average annual increase of 3.9%. Similar to cash rents, these ownership costs track changes in returns and land values.
Current and Total Returns on Owned vs Rented Farmland
As shown in Figure 1, combined ownership costs (farmland tax plus economic ownership or interest costs) have tracked average cash rents very closely both in terms of levels and trends. While there are periods where average cash rents exceed ownership costs, and vice versa, the average current net returns for owned and cash rented land are quite similar over the 25-year period from 2000 to 2024.
Farmland values have also increased through time. The average value of cropland in Illinois, as reported by USDA, has increased by nearly 6% annually since 2000 ($2,350 in 2000 to $9,850 per acre in 2025). Higher land values increase farmland real estate taxes and imply greater financing and opportunity costs but also benefit farmland owners through stronger balance sheets that can improve access to credit. Farmers in cash rent situations do not benefit from the capital gains associated with land value increases. Rather, they tend to face higher rental rates as land values increase.
Discussion
The experience on Illinois grain farms over the past 25 years suggests that the total (current plus capital) returns to farmer owned land exceed that of cash rented land. This highlights the importance of owned farmland for the building of wealth and as an important risk management strategy, particularly during periods when returns to rented land are low (see farmdoc daily article from April 1, 2025).
The preceding discussion also suggests that a greater portion of the operator and land return is now accruing to landowners. Net farmer returns have not increased from cash rented farmland while cash rents have increased. This benefits farmers to the extent that they are also landowners.
The increase in land values, coupled with higher interest rates since 2021 and lower returns since 2022, have made it more difficult for farmers to increase their owned land base. Higher land values increase the capital needed for down payments on real estate mortgages. Higher land values and interest rates increase the recurring cost of debt repayment. Lower returns make it more difficult to cash flow debt repayment and to build savings towards future farmland purchases. These challenges are more acute for farmers who have little to no existing owned land base and/or are already more highly leveraged. Traditional policy responses, such as ad hoc support payments, may be limited in their effectiveness to the extent that they continue to support higher costs.
Summary
Like most production costs, the costs associated with farmland have increased over time. This is true for both rental and ownership costs. In central Illinois, cash rental rates and economic ownership costs have increased at a faster rate (both around 4% per year) than farmland taxes (average of 3.5% per year), creating a widening gap between some of the costs of ownership versus renting. Farmland owners may also incur additional costs associated with maintenance and improvements but have also, on average, earned capital returns as farmland values have increased over time.
However, increasing land values, higher interest costs, and low margins on rented land have made it even more difficult for farmers to increase their owned land base. The trend towards a larger relative share of returns to farming accruing to landowners makes it increasingly difficult to identify solutions to assist producers during low return periods. Government support payments, for example, provide relief in the short term but likely exacerbate the growing gap between returns to owned and rented farmland, and increase the barriers to land ownership for many farmers by sustaining past and, potentially, future cost and land value increases beyond what would otherwise occur.
Acknowledgment
The authors would like to acknowledge that data used in this study comes from the Illinois Farm Business Farm Management (FBFM) Association. Without Illinois FBFM, information as comprehensive and accurate as this would not be available for educational purposes. FBFM, which consists of 5,000+ farmers and 70 professional field staff, is a not-for-profit organization available to all farm operators in Illinois. FBFM field staff provide on-farm counsel along with recordkeeping, farm financial management, business entity planning and income tax management. For more information, please contact our office located on the campus of the University of Illinois in the Department of Agricultural and Consumer Economics at 217-333-8346 or visit the FBFM website at www.fbfm.org.
References
Paulson, N., G. Schnitkey, B. Zwilling and C. Zulauf. "2026 Illinois Crop Budgets." farmdoc daily (15):150, Department of Agricultural and Consumer Economics, University of Illinois at Urbana-Champaign, August 19, 2025.
Schnitkey, G., C. Zulauf, N. Paulson and B. Zwilling. "Projected Farm Income for 2025: Importance of Rental Arrangements on Farm Income." farmdoc daily (15):60, Department of Agricultural and Consumer Economics, University of Illinois at Urbana-Champaign, April 1, 2025.
Zwilling, B. "Tenure Characteristics of Illinois Farmland." farmdoc daily (14):134, Department of Agricultural and Consumer Economics, University of Illinois at Urbana-Champaign, July 19, 2024.
Disclaimer: We request all readers, electronic media and others follow our citation guidelines when re-posting articles from farmdoc daily. Guidelines are available here. The farmdoc daily website falls under University of Illinois copyright and intellectual property rights. For a detailed statement, please see the University of Illinois Copyright Information and Policies here.