


Grains and Oilseeds: Part I – China and South America
Since 1980, South America’s increasing excess of its production over its consumption of grains and oilseeds has almost completely offset China’s growing excess of its consumption over its production of grains and oilseeds when expressed as a share of consumption. In short, the combined South America – China grain-oilseed demand-supply balance has changed little since 1980.
Data and Procedures
This study compares production and domestic consumption of grains and oilseeds by South America and China since 1980 as reported in the Production, Supply, and Distribution Online (PSD) database (US Department of Agriculture, Foreign Agriculture Service). Domestic consumption is the quantity consumed by a country from domestic production and imports. The study starts with the 1981/1982 crop year (hereafter, only first year is used). During the 1970s, several countries and crops were added to PSD. Moreover, a 1981 starting point follows the end of the 1970 crop prosperity period. Grains and oilseeds in this study include feed grains (barley, corn, millet, oats, sorghum), food grains (rice, rye, wheat), and oilseeds (cottonseed, peanuts, rapeseed, soybeans, sunflowers). These 13 crops should be considered collectively since they compete for acres and are demand substitutes and complements. Since the weight per unit differs by crop, the unit of measurement is metric ton.
South America: From Self-Sufficiency to Major Exporter
South America was self-sufficient (i.e., similar production and domestic consumption) in grains plus oilseeds until the late 1990s (see Figure 1). Production has since grown much faster. Over 2021-2025, South America’s production exceeded domestic consumption by an annual average of 178 million metric tons or 37% of production. This surplus underscores why South American grain-oilseed exports garner so much attention. For a discussion of recent domestic consumption trends in Brazil, South America’s largest producer of grains and oilseeds; see the June 9, 2025 farmdoc daily.

China: From Self-Sufficiency to Major Importer
China was also self-sufficient in grains and oilseeds until the late 1990s (see Figure 2). Domestic consumption has since grown much faster. Over 2021-2025, China’s domestic consumption exceeded its production by an annual average of 162 million metric tons per year or 20% of domestic consumption. This deficit underscores why China’s grain-oilseed imports garner so much attention. But, it is important to note that China produces 80% of its consumption of the grains and oilseeds in this study.

South America – China (SAC): Growing Together
When combined, South America plus China (hereafter, SAC) production and consumption of the grains and oilseeds in this study track each other over time (see Figure 3).

To further examine this relationship, the annual difference between production and domestic consumption as a share of domestic consumption is calculated. Positive values are production surpluses (i.e., production exceeds domestic consumption). Negative values are production deficits (i.e., domestic consumption exceeds productions). This percent share ratio for SAC has averaged 3.3% over 1981-2025, implying a SAC production surplus on average (see Figure 4). However, no time trend exists, implying SAC’s production surplus has not changed over time as a share of SAC consumption.

An implication of Figures 3 and 4 is that net SAC exports (i.e., SAC exports minus SAC imports) expressed as a share of SAC domestic consumption has also not trended statistically significantly up or down (see Figure 5). Note that occasionally SAC is a net importer of grains and oilseeds. To summarize this discussion, since 1980 production and consumption dynamics of South America and China have largely offset one another.

Impact on US Price
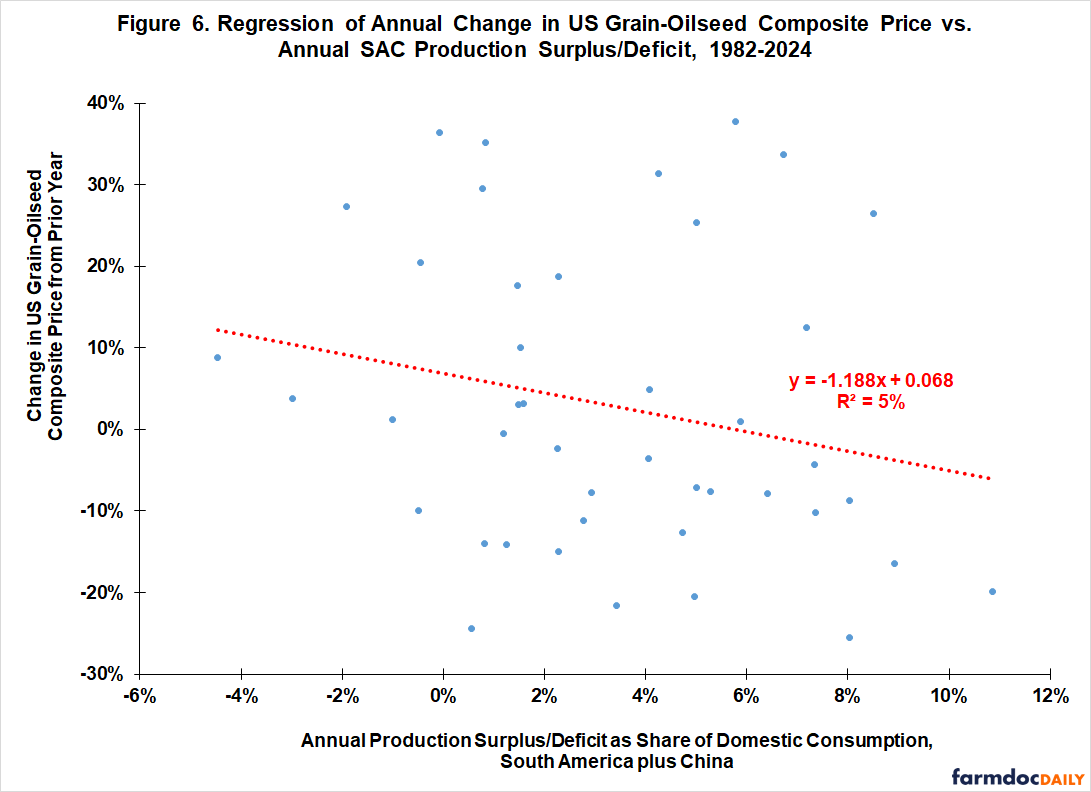
A regression analysis is conducted to estimate the ability of the annual SAC production surplus or deficit as a share of domestic consumption to explain the percent change of the US composite grain-oilseed price from the prior year. To illustrate these variables, the regression data set contains a dependent variable value of a -2.4% change in the US grain-oilseed composite price from the 1981 to 1982 crop years and an explanatory variable value of a +2.3% 1982 SAC production surplus to domestic consumption ratio. Construction of the composite price is discussed in the Data Note.
Explanatory power of SAC annual percent production surplus/deficit is only 5% (see Figure 6). Statistical confidence in the linear regression relationship is 84%, which is less than the lowest commonly-used confidence level to determine statistical significance (i.e., 90%). In short, these regression analysis findings are not consistent with SAC’s production surplus/deficit, as a single standalone variable, having a notable impact on the year-to-year changes in the US composite grain-oilseed price.
Discussion
Although Brazil dominates US attention, South American grains and oilseeds are far more than Brazilian grains and oilseeds (see November 7, 2022 farmdoc daily). In the 2024 crop year, countries other than Brazil accounted for 37% of South American grain plus oilseed production.
The preceding takes on added importance because South America’s grain-oilseed production window is off-cycle with China’s (and US’s) northern hemisphere production window. Sourcing from South America spreads out demands on China’s grain-oilseed storage and supply chain infrastructure and allows it to obtain supplies at a second harvest price low. In short, South America is a more natural supplier of grains and oilseeds to China than the US.
US geopolitical policy toward China, including tariffs, is solidifying the South America – China grain-oilseed sector. However, historical contexts for this contemporary event include (1) the lack of any time trend in the combined SAC grain-oilseed production surplus since 1980 and (2) the limited ability of SAC grain-oilseed production surpluses as a single variable to explain changes in the composite US grain-oilseed price. These historical contexts suggest that anxiety over the increasingly close tie between South America and China is not warranted until the SAC grain-oilseed production surplus starts to grow year over year as a share of SAC consumption.
The next article in this series will examine trends in US grain-oilseed production surpluses. The third article in the series will examine trends in the grain-oilseed production surpluses of the rest of the world. The fourth article will use regression analysis to assess the relative ability of US, SAC, and rest of the world production surpluses to explain changes in the composite US grain-oilseed price.
Data Note
The US composite price index for the grains and oilseeds included in this study was calculated as follows. First, each grain and oilseed’s US average price for the 1981 through 2024 market years were obtained from QuickStats, a database maintained by the US Department of Agriculture, National Agricultural Statistical Service. Second, all per bushel prices were converted to price per pound by using the crop’s standard pounds per bushel conversion factor. Third, each crop’s price per pound was weighted by the crop’s share of total US grain and oilseed production for the year. Fourth, the weighted prices were summed across the crops. This sum was the US composite grain-oilseed price for the market year.
References
Colussi, J., G. Schnitkey and N. Paulson. "Brazil’s 2024–25 Corn Harvest Grows, But Exports Projected to Decrease." farmdoc daily (15):105, Department of Agricultural and Consumer Economics, University of Illinois at Urbana-Champaign, June 9, 2025.
US Department of Agriculture, National Agricultural Statistics Service. August 2025. QuickStats. https://quickstats.nass.usda.gov/
US Department of Agriculture, Foreign Agriculture Service. August 2025. Production, Supply, and Distribution Online. https://apps.fas.usda.gov/psdonline/
Zulauf, C., G. Schnitkey, J. Colussi, N. Paulson and J. Janzen. "South American Corn and Soybeans in US Perspective." farmdoc daily (12):167, Department of Agricultural and Consumer Economics, University of Illinois at Urbana-Champaign, November 7, 2022.
Disclaimer: We request all readers, electronic media and others follow our citation guidelines when re-posting articles from farmdoc daily. Guidelines are available here. The farmdoc daily website falls under University of Illinois copyright and intellectual property rights. For a detailed statement, please see the University of Illinois Copyright Information and Policies here.