


Solvency Series: Debt Related Characteristics of Grain Farms by Debt Service Costs in 2024
In our previous article (see farmdoc daily, September 26, 2025), we examined the debt-to-asset ratio and interest expense per tillable acre of Illinois grain farms across the lower quartile, median, and upper quartile from 2003 to 2024. We found that debt-to-asset ratios declined from 2003 to 2012, then stabilized, with modest increases for highly leveraged farms, between 2012 and 2019, and fell again from 2019 to 2022, before ticking upward in 2022–2024. In contrast, interest per tillable acre fluctuated with interest rate cycles, rising steadily after 2013, easing during the pandemic, and then rising sharply from 2022 to 2024—especially for the 25% of grain farms carrying the heaviest debt loads.
In today’s article, we examine the debt-related financial characteristics of Illinois grain farms enrolled in Illinois Farm Business Farm Management (FBFM) based on their position in the distribution of interest per tillable acre in 2024. On a per-acre basis, we follow four cohorts over time: farms with interest expenses (1) above the upper quartile, (2) between the median and upper quartile, (3) between the lower quartile and median, and (4) below the lower quartile. For each cohort, we track changes from 2019 to 2024 in average debt-to-asset ratios, debt per tillable acre, assets per tillable acre, and interest per tillable acre. This approach allows us to follow the same set of farms across time and see how their financial characteristics evolved.
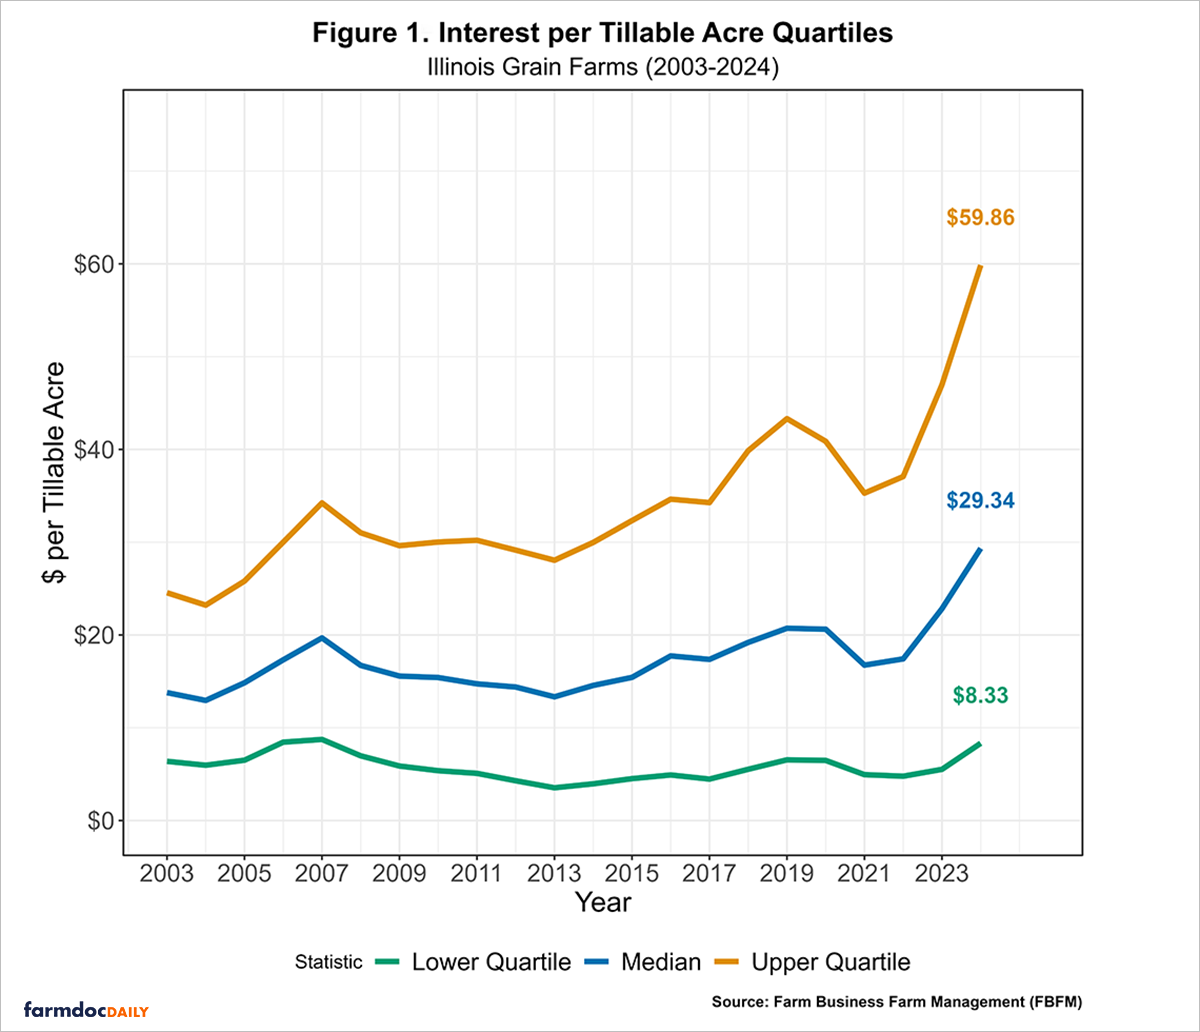
Figure 1 shows the quartile levels of interest expense per tillable acre from 2003 to 2024. The lower quartile (25th percentile) marks the cutoff below which 25% of farms with the lowest interest costs fall, the median (50th percentile) marks the midpoint of the distribution (with half paying more and half less in interest expense per tillable acre), and the upper quartile (75th percentile) marks the cutoff above which 25% of farms with the highest interest costs fall. In 2024, interest expenses reached $59.86 per tillable acre at the upper quartile, $29.34 at the median, and $8.33 at the lower quartile.
Using these 2024 quartile levels of interest per tillable acre, we classify farms into four cohorts as shown in Figure 2. Farms with interest expenses (1) above the upper quartile form the high interest expense cohort, (2) those between the median and upper quartile make up the moderate-high interest expense cohort, (3) those between the lower quartile and median fall into the moderate-low interest expense cohort, and (4) those below the lower quartile form the low interest expense cohort. Therefore, the average debt-to-asset ratios, debt per tillable acre, assets per tillable acre, and interest per tillable acre reported in Figure 2 represent the same sets of farms tracked over time. However, in years prior to 2024, there may be instances where a farm isn’t reported in its cohort because it either wasn’t enrolled in the FBFM program or did not have a certified usable balance sheet. Given the numerous inquiries we have received from stakeholders regarding recent debt dynamics, our analysis will primarily focus on the high interest expense and moderate-high interest expense cohorts, addressing key concerns about leverage and interest cost pressures amid a high interest rate environment. However, we will briefly describe the characteristics of the remaining two cohorts for context.
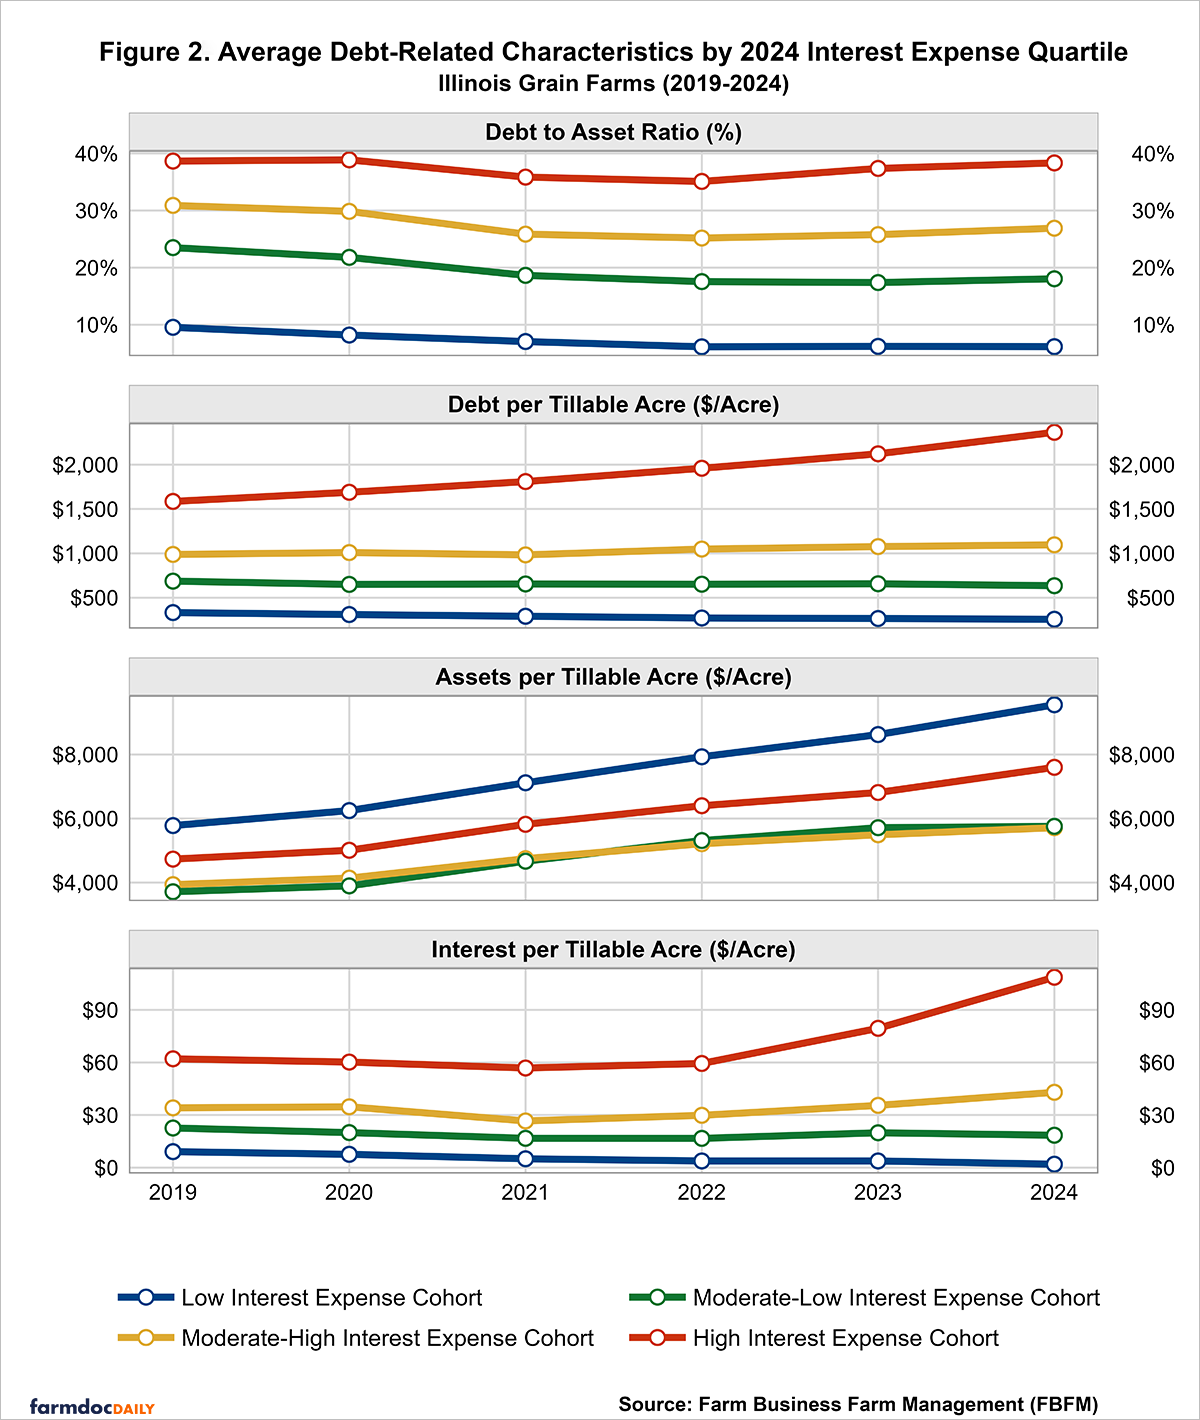
The average debt-to-asset ratio for the high interest expense cohort consistently remained above 35% from 2019 to 2024, placing these farms in the cautionary risk category (30%–60%) according to the Center for Farm Financial Management’s Farm Financial Scorecard—though closer to the lower end of that range. [1] The average debt-to-asset ratio fell from 38.65% (cautionary) in 2019 to 35.09% (cautionary) in 2022, before rising again to 38.33% (cautionary) in 2024. This cohort’s average debt per tillable acre consistently rose over the period from $1,585.23 in 2019 to $2,364.24 in 2024. However, their average assets per tillable acre consistently rose too, increasing from $4,731.48 in 2019 to $7,598.75. Lastly, average interest per tillable acre for this cohort remained stable prior to the federal funds rate hikes in 2022, but surged from $59.42 in 2022 to $79.49 in 2023, and further to $108.65 in 2024, highlighting the impact of rising interest rates on this cohort.
The moderate-high interest expense cohort, representing grain farms with mid-to-high interest expense per tillable acre in 2024, displayed a much different dynamic over the period. The average debt-to-asset ratio was 30.89% (cautionary) in 2019, and declined to a low of 25.17% (strong) in 2022 before rising to 26.89% (strong) in 2024. Unlike the high interest expense cohort, average debt per tillable acre for the moderate-high interest expense cohort remained relatively stable over this period, rising from $987.68 in 2019 to $1,096.32 in 2024. Meanwhile, average assets per tillable acre grew substantially, from $3,934.93 in 2019 to $5,712.25 in 2024. Average interest per tillable acre fell from $34.09 in 2019 to $29.83 in 2022, then increased to $35.50 in 2023 and $42.97 in 2024, as interest rates rose.
Lastly, on average, the moderate-low and low interest expense cohorts improved their debt-to-asset ratios over this period and remained within the strong category (<30%). The former maintained a steady average debt per tillable acre value, while the latter decreased it over time. Additionally, the average interest per tillable acre for these two cohorts remained healthy, with the former modestly decreasing its debt servicing cost over time, while the latter achieved a more substantial reduction.
Conclusion
Overall, our findings highlight the uneven financial pressures facing Illinois grain farms in the current high interest rate environment. Farms in the high interest expense cohort remain in a cautionary leverage position (debt-to-asset ratio of 30-60%), with rising debt and surging interest costs posing clear financial stress despite asset growth. By contrast, farms in the moderate-high interest expense cohort have generally strengthened their balance sheets, keeping leverage in the strong range (debt-to-asset ratio <30%) even as interest costs began to rise after 2022. The moderate-low and low interest expense cohorts show even greater resilience, with healthy leverage levels and manageable interest cost burdens. Taken together, the evidence suggests that while most farms are well-positioned to weather higher borrowing costs, those with the heaviest debt loads face the highest financial strain. As interest rate policy and farm income conditions continue to evolve, close monitoring of these highly leveraged farms will be essential for anticipating potential financial strain in the sector.
Acknowledgment
The authors would like to acknowledge that data used in this study comes from the Illinois Farm Business Farm Management (FBFM) Association. Without Illinois FBFM, information as comprehensive and accurate as this would not be available for educational purposes. FBFM, which consists of 5,000+ farmers and 70 professional field staff, is a not-for-profit organization available to all farm operators in Illinois. FBFM field staff provide on-farm counsel along with recordkeeping, farm financial management, business entity planning and income tax management. For more information, please contact our office located on the campus of the University of Illinois in the Department of Agricultural and Consumer Economics at 217-333-8346 or visit the FBFM website at www.fbfm.org.
Note
[1] The Farm Financial Scorecard adheres to the guidelines set by the Farm Financial Standards Council
References
Mashange, G. and B. Zwilling. "Solvency Series: Healthy Debt-to-Asset Ratios Amid Rising Debt Servicing Costs." farmdoc daily (15):177, Department of Agricultural and Consumer Economics, University of Illinois at Urbana-Champaign, September 26, 2025.
Disclaimer: We request all readers, electronic media and others follow our citation guidelines when re-posting articles from farmdoc daily. Guidelines are available here. The farmdoc daily website falls under University of Illinois copyright and intellectual property rights. For a detailed statement, please see the University of Illinois Copyright Information and Policies here.