


Cover Crop Adoption: Results from 5 Years of Ag Economy Barometer Surveys
When thinking about the adoption of conservation practices, like cover crops, it is important to note two things. First, adoption rates have ebbs and flows; in other words, adoption does not necessarily follow a steady trend. Second, sometimes conservation practices are disadopted, which may happen due to the termination of incentive payments and/or lack of profitability. This article examines trends in the adoption of cover crops, cover crop experience, and percentage of acres planted to cover crops using data from the September Purdue University-CME Group Ag Economy Barometer (AEB) surveys for the last five years.
The AEB survey is conducted each month to gauge producer sentiment among a group of U.S. agricultural producers (Langemeier and Mintert, 2025). In addition to questions pertaining to sentiment, monthly AEB surveys periodically include questions pertaining to the adoption of production practices, such as cover crops.
Adoption of Conservation Practices
Nationwide, cover crops were planted on 4.7% of total cropland in 2022 (Bowman and Morales, 2024). Plastina et al. (2024) examined cover crop adoption in Iowa, Illinois, and Indiana using 2012, 2017, and 2022 Census data. The adoption rate in 2022 was 5.1% of all cropland in the three states, which was 0.9% higher than the adoption rate reported in 2017. From 2012 to 2017, there was a 3.0% increase in the adoption rate in the three states.
Disadoption of conservation practices occurs when the expected benefits associated with adopting a practice are outweighed by its costs. Plastina et al. (2024) noted that adoption rates in 94 of the 291 counties in the I-States for which data were available declined (i.e., disadoption occurred) from 2017 to 2022. This represents 32% of all counties in these states.
Most Farmers Have Tried Cover Crops
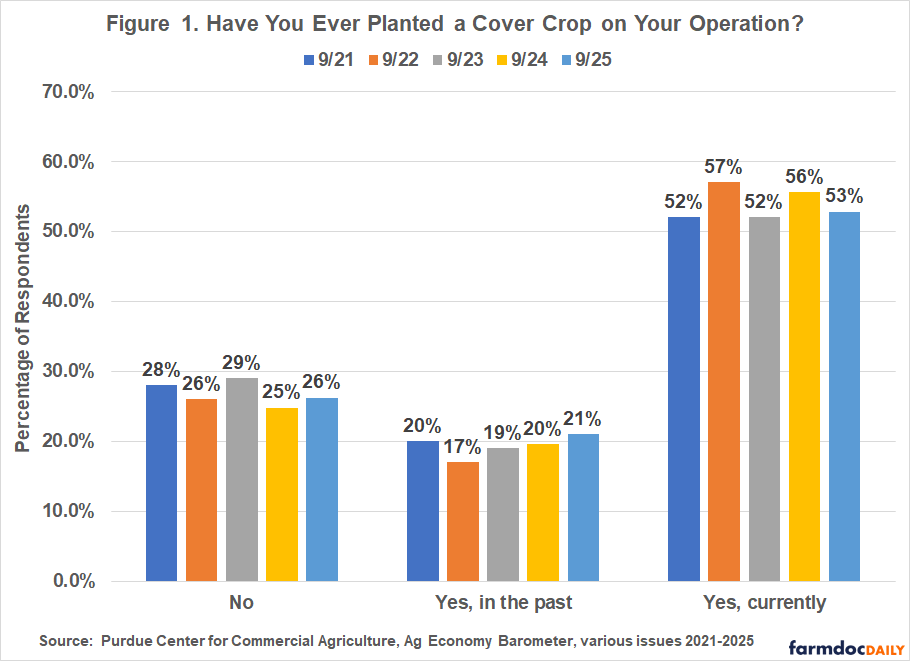
In September of the last five years, the AEB survey has included cover crop questions related to adoption, experience, and percentage of acres planted to cover crops. The cover crop adoption question is worded as follows: Have you ever planted a cover crop on your operation? Response choices include: Yes, currently; Yes, in the past; and No. From 2021 to 2025 the percentage of AEB survey respondents who reported that they currently use cover crops ranged from 52% to 57%, and averaged 53% in September 2025 (see Figure 1). Similar to results from previous surveys, 21% of the 2025 respondents reported planting cover crops in the past (i.e., disadopted cover crops), but do not currently plant cover crops on their farm. The remainder of the respondents in the September 2025 survey, 26%, reported having never planted cover crops.
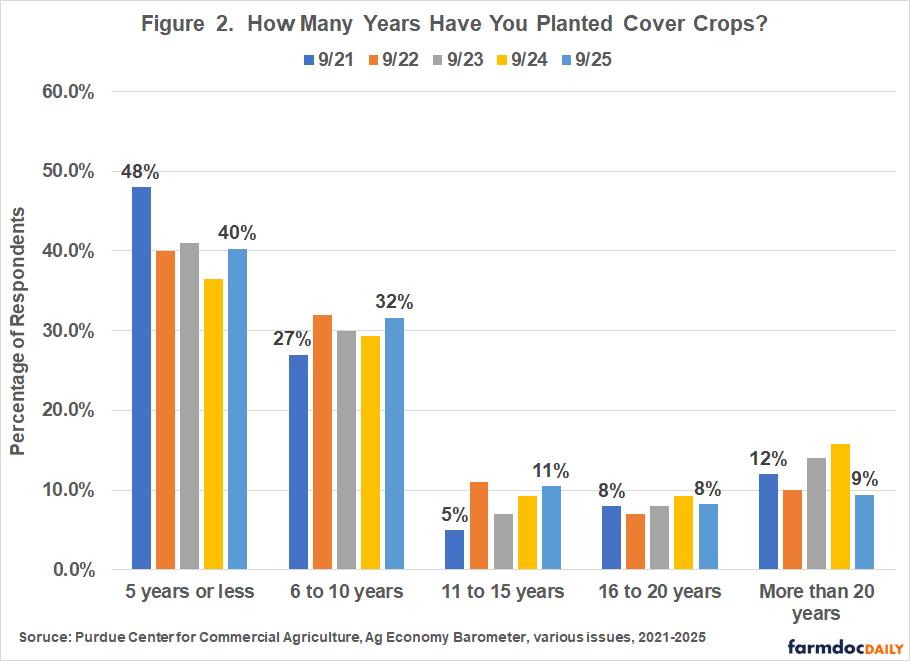
The AEB survey question pertaining to experience is worded as follows: How many years have you planted cover crops? Response choices include: 5 years of less, 6 to 10 years, 11 to 15 years, 16 to 20 years, and more than 20 years. This question is only posed to those who currently plant cover crops. Figure 2 illustrates the number of years that survey respondents have planted cover crops using results from September surveys from 2021 to 2025. In September 2025, the average number of years the respondents have planted cover crops was 10.5 years. However, the distribution is skewed to the left with 72% of the respondents indicating that they have planted cover crops for 10 years or less.
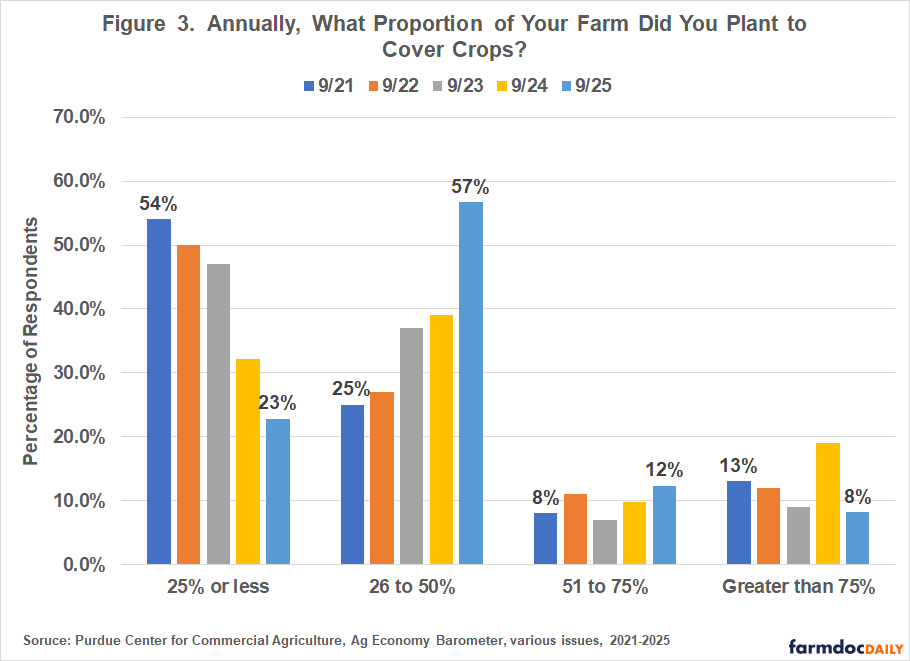
To gauge how prevalent cover crops are on the farms that currently plant cover crops, the following question was asked: Annually, on what proportion (percentage) of your farm did you plant cover crops? Response choices include: 25% or less; 26 to 50%, 51 to 75%, and greater than 75%. This question was only posed to those who currently plant cover crops. Figure 3 presents the results for the last five years. The average percentage of farm acreage devoted to cover crops reported by respondents in the September 2025 survey was 42%. Interestingly, there were fewer respondents in the latest survey who planted cover crops on less than 25% of their acreage and more respondents who planted cover crops on 26 to 50% of their acreage than in any previous AEB survey.
If we combine the answers to the cover crop adoption and the percentage of acres planted to cover crop questions, we can obtain an estimate of acreage adoption for the entire survey sample. Specifically, multiplying the average cover crop adoption rate (53%) by the average percentage of acres planted to cover crops (42%) yields an estimate of acreage adoption (22%). The percentage of acres with cover crops for the AEB survey respondents (22%) is substantially higher than the U.S. average (4.7%). It is important to note that, unlike the Census of Agriculture, the AEB monthly surveys focus on full-time farms.
Motivation for Planting Cover Crops
To delve into why the acreage adoption rate is relatively higher for AEB survey respondents, motivations for planting cover crops and respondent’s experience with cover crops should be considered. In the September 2024 AEB survey, questions pertaining to motivations for planting cover crops and what best describes your experience with cover crops were posed. Response choices for the motivation question were as follows: Improves soil health; Improves erosion control; Improves water quality; Carbon sequestration, and Other. The two most common choices, Improves soil health and Improves erosion control, were each chosen by approximately one-third of the respondents.
The question related to experience with cover crops was stated as follows: Which statement best describes your experience with cover crops? Response choices included the following: Improves soil health and crop yields; Improves soil health and hurts crop yields; Does not improve soil health, but improves crop yields; and Does not improve soil health or crop yields. The first response, Improves soil health and crop yields, was chosen by 75% of those that currently plant cover crops.
Conclusions
Monthly AEB surveys frequently include questions pertaining to the adoption of production practices such as no-till adoption and cover crop adoption. This article examined trends in cover crop adoption using September survey results for the last five years. Approximately 53% of AEB survey respondents currently plant cover crops. This percentage has ranged from 52% to 57% over the last five years of surveys. Approximately 40% of the respondents who currently plant cover crops have planted cover crops for 5 years or less, while approximately 9% of respondents have planted cover crops for more than 20 years. Approximately 23% of the respondents who currently plant cover crops planted cover crops on less than 25% of their acreage. Combining average responses from the cover crop adoption and percentage of acres planted to cover crops from the September 2025 survey, yields an adoption rate of approximately 22%. In contrast, the adoption rate reported in the 2022 Census was only 4.7%. Not profitable and hurting crop yields are often cited as reasons not to adopt cover crops or discontinue planting cover crops. Of those included in the September 2024 AEB survey who currently use cover crops, the vast majority indicated that cover crops improve soil health and crop yields.
The results from five years of AEB surveys suggest that cover crop adoption among U.S. farmers has remained relatively stable, but experience and intensity of use continue to expand. While adoption rates are much higher for AEB respondents than the national average, profitability concerns and yield impacts remain key barriers to broader adoption. Continued monitoring of these trends will be important to understand how economic conditions, incentive programs, and agronomic outcomes influence the long-term sustainability of cover crop use.
References
Bowman, M. and M. Morales. “2022 Census of Agriculture: Cover Crop Use Continues to be Most Common in Eastern United States.” USDA-ERS, Charts of Note, April 16, 2024.
Langemeier, M. and J. Mintert. “Farmers Say Current Conditions on U.S. Farms are Weakening.” Ag Economy Barometer, October 7, 2025. (https://ag.purdue.edu/commercialag/ageconomybarometer/).
Plastina, A., W. Sawadgo, and E. Okonkwo. “Cover Crop Adoption and No-Till Area Stagnates in the I-States.” CARD Agricultural Policy Review, Iowa State University, Winter 2024.
Disclaimer: We request all readers, electronic media and others follow our citation guidelines when re-posting articles from farmdoc daily. Guidelines are available here. The farmdoc daily website falls under University of Illinois copyright and intellectual property rights. For a detailed statement, please see the University of Illinois Copyright Information and Policies here.