


Expected Yields for SCO and ECO in Illinois
Many farmers will be considering the Supplemental and Enhanced Coverage Options (SCO and ECO) this year, as subsidy levels for these federal crop insurance products have been increased from 65% to 80% (see farmdoc daily article from July 2, 2025). SCO and ECO premiums and payments depend on county expected and actual yields. We examine the 2026 expected yields for SCO and ECO. In many counties, the Risk Management Agency (RMA) increased the expected 2026 yields significantly above 2025 levels. Still, we find many of the expected yields for Illinois counties are below what one should expect given the crop’s recent historical experience, particularly for soybeans. In counties where the expected SCO and ECO yields are perceived to too low, producers may find the supplemental programs less attractive.
Background
Each year, RMA releases expected yields for county-level products. Those yields are used to set guarantees for SCO and ECO. For example, SCO, when combined with a Revenue Protection (RP) policy, sets its guarantee based on 86% of expected revenue which equals:
Expected yield times the higher of projected or harvest price
Likewise, ECO’s guarantee is based on 90% or 95% of the expected revenue.
The advisability of taking SCO and ECO is influenced by how well expected yields match the county’s expectations. The expected yield for an area should be roughly equal to the yield that would occur under normal growing conditions for that period. Research has shown that crop yield distributions, particularly in the Midwest, are not perfectly symmetric, exhibiting negative skewness. This means that yields should be expected to be above the expected yield slightly more than 50% of the time, and yields should be below the expected yield slightly less than 50% of the time. For many counties in Illinois, actual yields have exceeded expected yields in most years.
Non-irrigated soybeans in Logan County, Illinois, are used to illustrate the development of expected yields. SCO has been available since 2015. To arrive at expected yields and actuarially fair rates for SCO, RMA constructed a historical time series of actual area yields going back to 1991. The full historical actual yield series for non-irrigated soybeans in Logan County, Illinois, is provided in green in Figure 1, with a dashed vertical line at 2015 indicating the introduction of SCO.
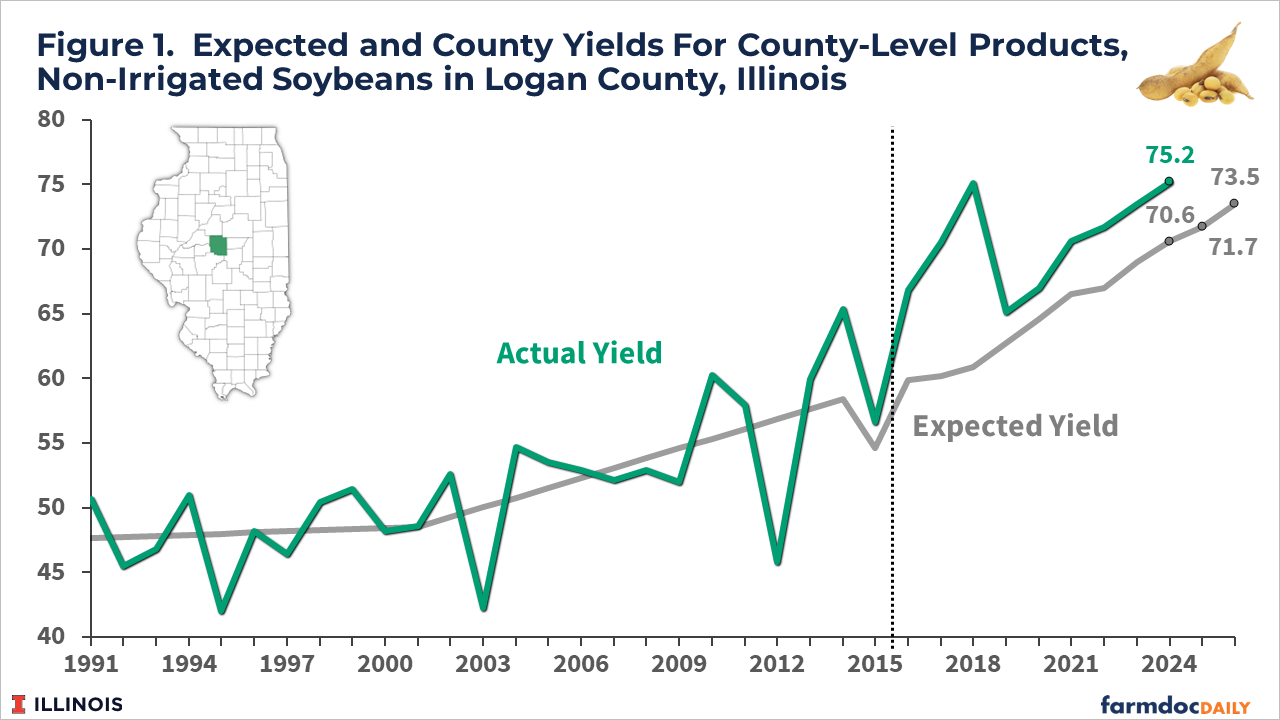
RMA establishes expected yields using statistical methods to fit a line to the actual yields, with restrictions to control for potential anomalies in the data that may result in adjustments to an otherwise smoothly fitted line. The expected RMA yields are shown as the gray line in Figure 1. In Logan County, non-irrigated soybean yields have trended up through time. The expected yield line reflects this with a positive slope that was adjusted upward slightly around 2002.
Expected yields since 2015 have incorporated various adjustments that can impact expected yields differently each year. The adjustments included a downward adjustment in expected yield from 2014 to 2015, and then an increase in expected yield for each year since 2015. While increasing every year, the expected yield has been below the actual non-irrigated soybean yield in Logan County, Illinois, in each of the 10 years since 2015.
RMA increased many of 2026 expected yields over 2025 levels. For example, the expected yield for Logan County was 71.7 bushels per acre in 2025, increasing by 1.8 bushels to 73.5 bushels per acre in 2026. Across all counties in Illinois, the 2026 expected yield averaged 0.8 bushels higher than the 2025 expected yield, with a range of 0.1 bushels per acre decrease in Winnebago County and a 2.3 bushels per acre increase in Brown and Piatt Counties. Panel A of Figure 2 shows 2026 expected yields for non-irrigated soybeans in all Illinois counties.
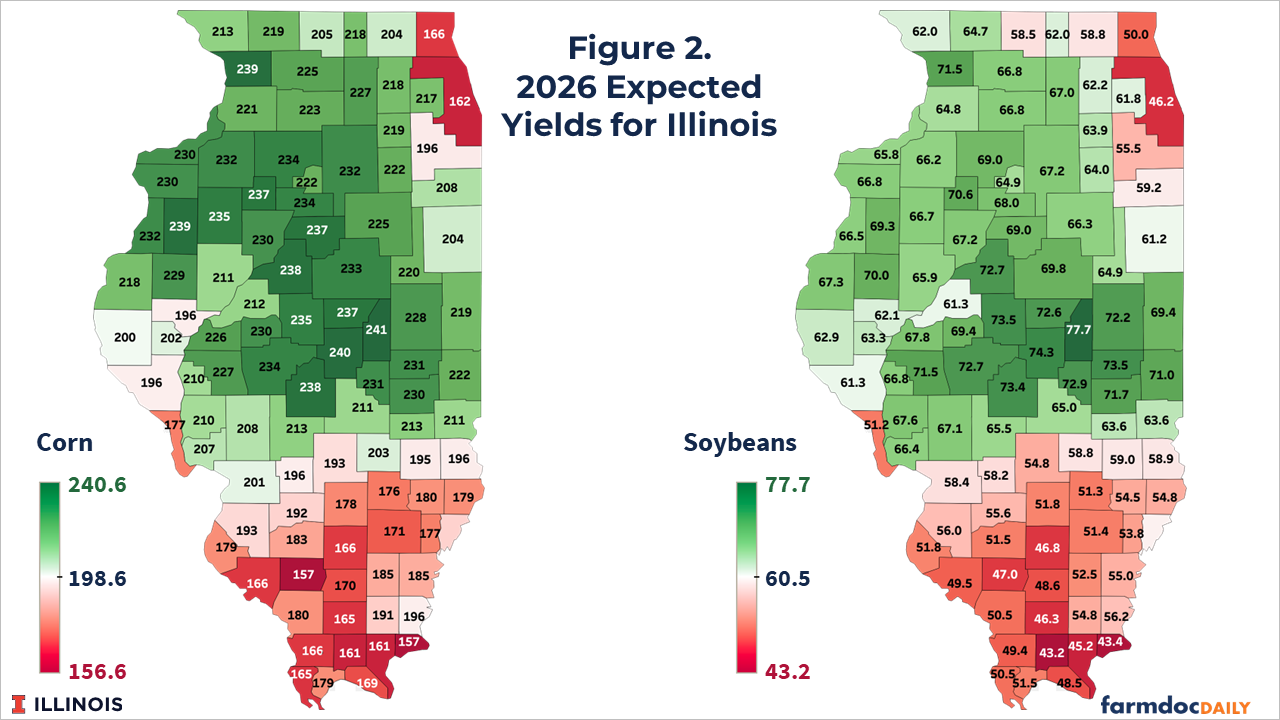
Panel B shows 2026 expected yields for non-irrigated corn. In most counties, the 2026 expected yields average considerably higher than 2025 yields, with an average increase of 4.6 bushels per acre. The range is a zero bushel increase for Will and Williamson Counties, and 9.7 bushels per acre increase for Alexander County.
Adjustments Impacts on Expectations
An earlier farmdoc daily article (June 24, 2025) showed that RMA expected yields have significantly lagged actual corn and soybean yields in the Midwest. Recent increases in expected yields seem likely to improve performance for area programs in 2026, providing more accurate representations of yield potential in many Illinois counties.
To evaluate, we first calculated the trend increase experienced in actual yields using complete data from 1991 to 2024. During this period, for example, soybean yields in Logan County increased an average of .9 bushels per year. We then stated each yield from 2015 to 2024 in 2026 bushels. For example, the 2015 yield of 56.6 bushels was increased by 9.9 bushels to 65.9. The 9.9 bushel increase equals the .9 trend increase times 11, the number of years from 2015 to 2026. In essence, this increase assumes that all historical yields would be higher if those growing conditions were experienced in 2026, based on the trend increase. We then counted the number of years in which the trend-adjusted annual yields exceeded the expected yield. With 10 years of yields, if expected yields accurately reflect yield potential for a county, we would expect actual (trend-adjusted) yields to be above the expected trend yield in 5-7 of those years. We acknowledge that this is a relatively short time-series, and it is statistically possible to observe more or fewer years above expectations.
Panel A of Figure 3 shows number of years in which the trend-adjusted actual yield exceeded the expected yield for 2026. Note that actual yields are often above 7, particularly in the center of the state. There are many counties where yields were above the expected yield in 9 or 10 of the years. Fewer years above the expected yield occur in the northern and southern parts of the state.
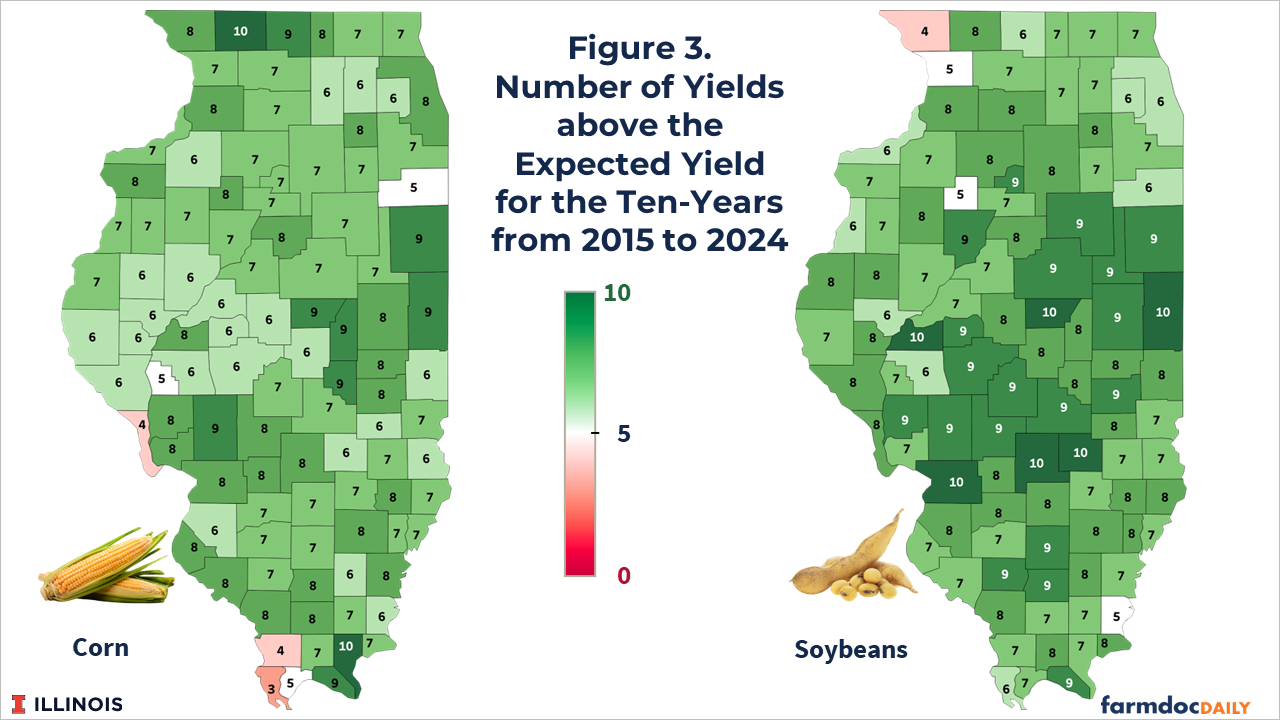
Panel B of Figure 3 shows the same analysis for corn. While it has been more common for yields to be below the expected for corn than for soybeans, there are still many Illinois counties where corn yields have exceeded the expected year in 8 or more of the 10 years examined.
Implications
While RMA has been raising expected yields, the above results suggest they may still not accurately reflect the yield potential typically observed in Illinois counties. This fact is particularly true in central Illinois and for soybeans. This could reduce the attractiveness of SCO and ECO more than if expected yields more adequately reflected recent historical experience of actual yields. Still, farmers are still encouraged to consider SCO and ECO for 2026 because of their high premium subsidy levels.
This analysis also suggests that while trend RMA yields have increased, further analysis and adjustments to RMA’s procedures used to set expected area yields is warranted in Illinois.
References
Schnitkey, G., N. Paulson, C. Zulauf, J. Coppess and B. Sherrick. "Dramatic Difference in Expected Yields between Corn, Soybeans, and Cotton for Area-Based Insurance Products." farmdoc daily (15):115, Department of Agricultural and Consumer Economics, University of Illinois at Urbana-Champaign, June 24, 2025.
Zulauf, C., B. Sherrick and G. Schnitkey. "Response to the Increase in 2025 Crop ECO Premium Subsidy." farmdoc daily (15):121, Department of Agricultural and Consumer Economics, University of Illinois at Urbana-Champaign, July 2, 2025.
Disclaimer: We request all readers, electronic media and others follow our citation guidelines when re-posting articles from farmdoc daily. Guidelines are available here. The farmdoc daily website falls under University of Illinois copyright and intellectual property rights. For a detailed statement, please see the University of Illinois Copyright Information and Policies here.