


Dramatic Difference in Expected Yields between Corn, Soybeans, and Cotton for Area-Based Insurance Products
Both the House and Senate Reconciliation Bills include provisions to encourage the purchase of the Supplemental Coverage Option (SCO), a crop insurance product providing county coverage above Revenue Protection (RP) and other farm-level products. The performance of SCO is greatly influenced by how the Risk Management Agency (RMA) calculates expected yields. Those expected yields are used to determine guarantees for area-based products. Since 2015 when SCO was first offered, actual county-level yields of corn and soybeans in the Midwest have been above expected yields in most years, implying a continuation of historical increases in yield and lower expectations for indemnities. On the other hand, actual county-level yields have been below expected yields for the majority of years for cotton, raising a question of whether the historical increase in cotton yields has slowed or plateaued. There is little reason to expect different results in the future.
Background
The Stacked Income Protection Plan (STAX) for upland cotton, Supplemental Coverage Option (SCO), and Enhanced Coverage Option (ECO) are examples of area products offered through the Federal crop insurance programs (see farmdoc daily, June 13, 2024, June 10, 2025). Those products have their insurance guarantees based on expected yields. For example, an area-based product offering revenue coverage defines the revenue guarantee as the product of the coverage level, expected yield, and the applicable insurance price.
The expected yields are developed by the Risk Management Agency (RMA) using analysis of historical time series data on actual yields. Accurate expected yields are crucial for achieving optimal area-based coverage performance. Expected yields that are too high for an area will result in payments being triggered too frequently, with payments that are too large relative to actual losses. Expected yields that are too low will result in payments that are not triggered enough and are too small to cover realized losses.
The expected yield for an area should be roughly equal to the yield that would occur under normal growing conditions for that period. Research has shown that crop yield distributions, particularly in the Midwest, are not perfectly symmetric, exhibiting negative skewness. This means that yields should be expected to be above the expected yield slightly more than 50% of the time, and yields should be below the expected yield slightly less than 50% of the time. Below, we compare the actual and expected yields reported by RMA for non-irrigated corn, soybeans, and cotton, and irrigated cotton across US counties. Specific counties are also included as examples for each.
Logan County, Illinois
Non-irrigated soybeans in Logan County, Illinois are used to illustrate the development of expected yields. The Supplemental Coverage Option (SCO) has been available since 2015. To arrive at expected yields and actuarially fair rates for SCO, and more recently the Enhanced Coverage Option (ECO), RMA constructed historical time series of actual yields going back to 1991. The full historical actual yield series for non-irrigated soybeans in Logan County, Illinois are provided in green in Figure 1, with a dashed vertical line at 2015 indicating the introduction of SCO.
The establishment of expected yields by RMA is achieved using statistical methods to fit a line to the actual yields with some restrictions to control for possible anomalies in data that can result in adjustments to an otherwise smoothly fitted line. The result of this process is shown as the gray line in Figure 1. In Logan County, non-irrigated soybean yields have trended up through time. The expected yield line reflects this with a positive slope that was adjusted upward slightly around 2002.
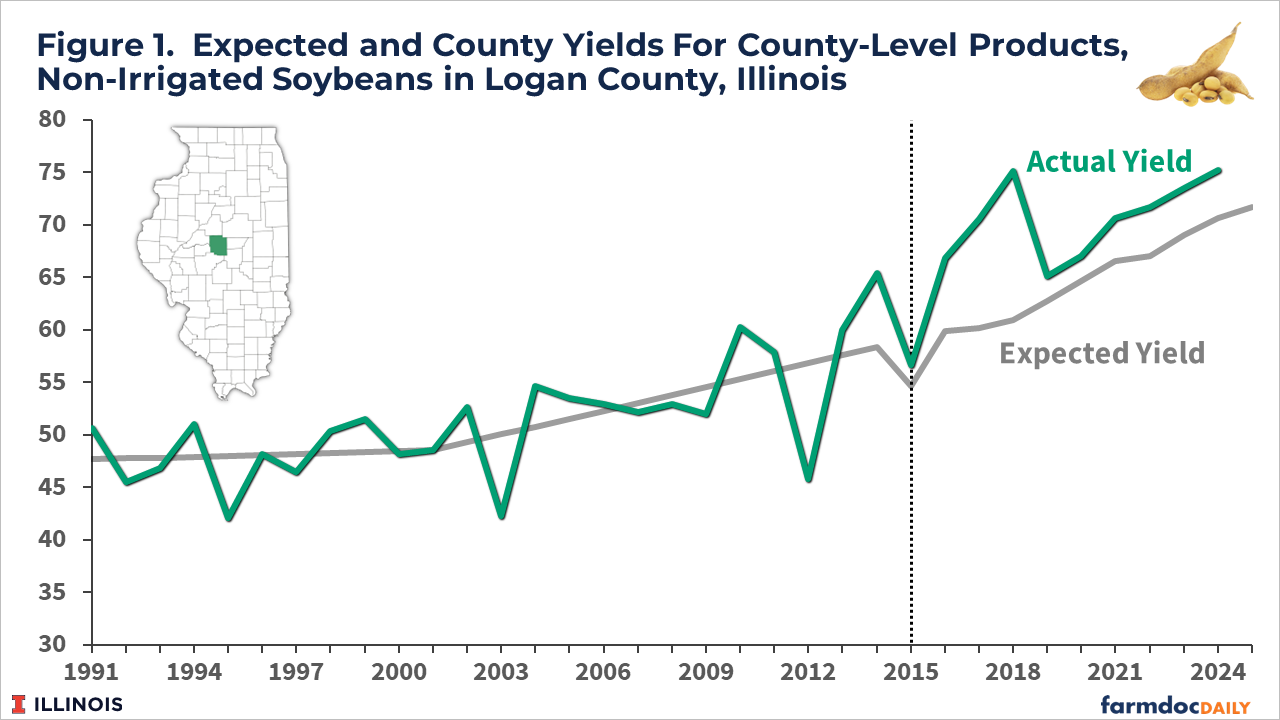
Expected yields since 2015 have incorporated various adjustments that can impact expected yields differently each year. The adjustments included a downward adjustment in expected yield from 2014 to 2015, and then an increase in expected yield for each year since 2015. While increasing every year, the expected yield has been below the actual non-irrigated soybean yield in Logan County, Illinois in each of the 10 years since 2015. Importantly, empirical loss rates in Logan County are also very low for county-based products as a result.
Non-Irrigated Corn and Soybean Yields
Figures 2 and 3 provide maps of U.S. counties with actual and expected yield data for non-irrigated soybeans and corn from the RMA. The majority of counties have had actual yields that exceed the area’s expected yields in most years since 2015 (counties shaded in blue).
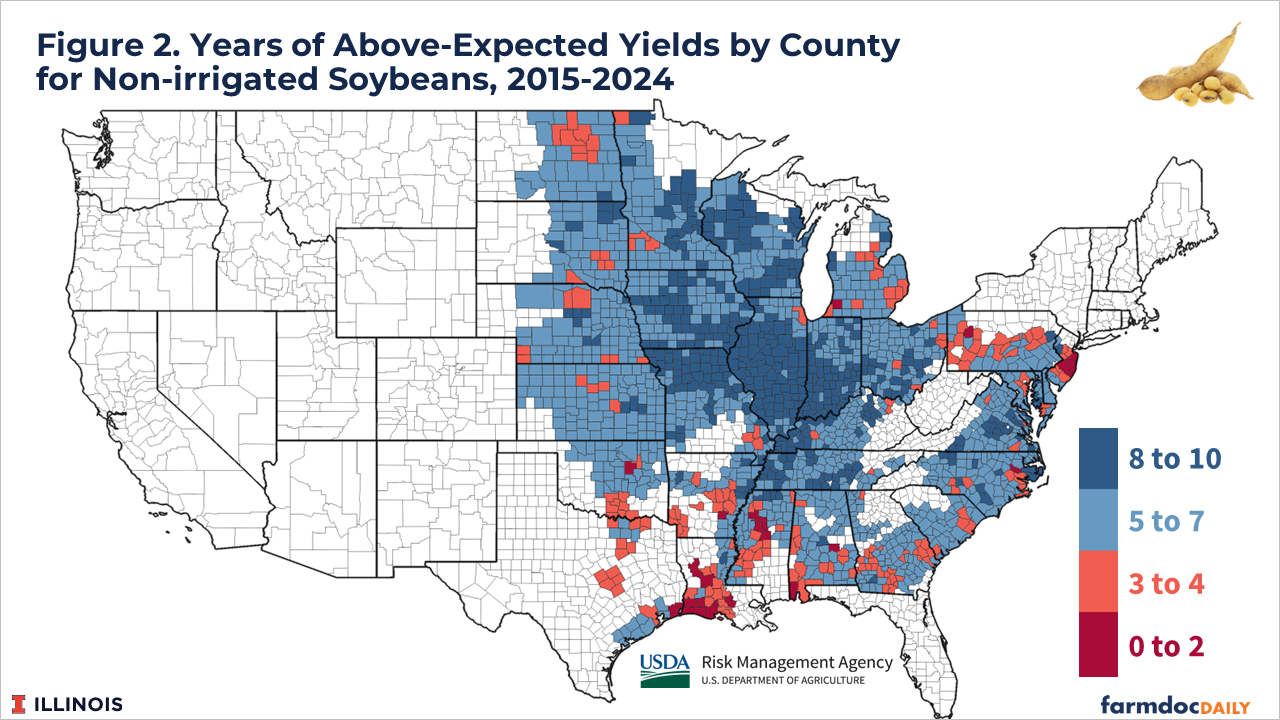
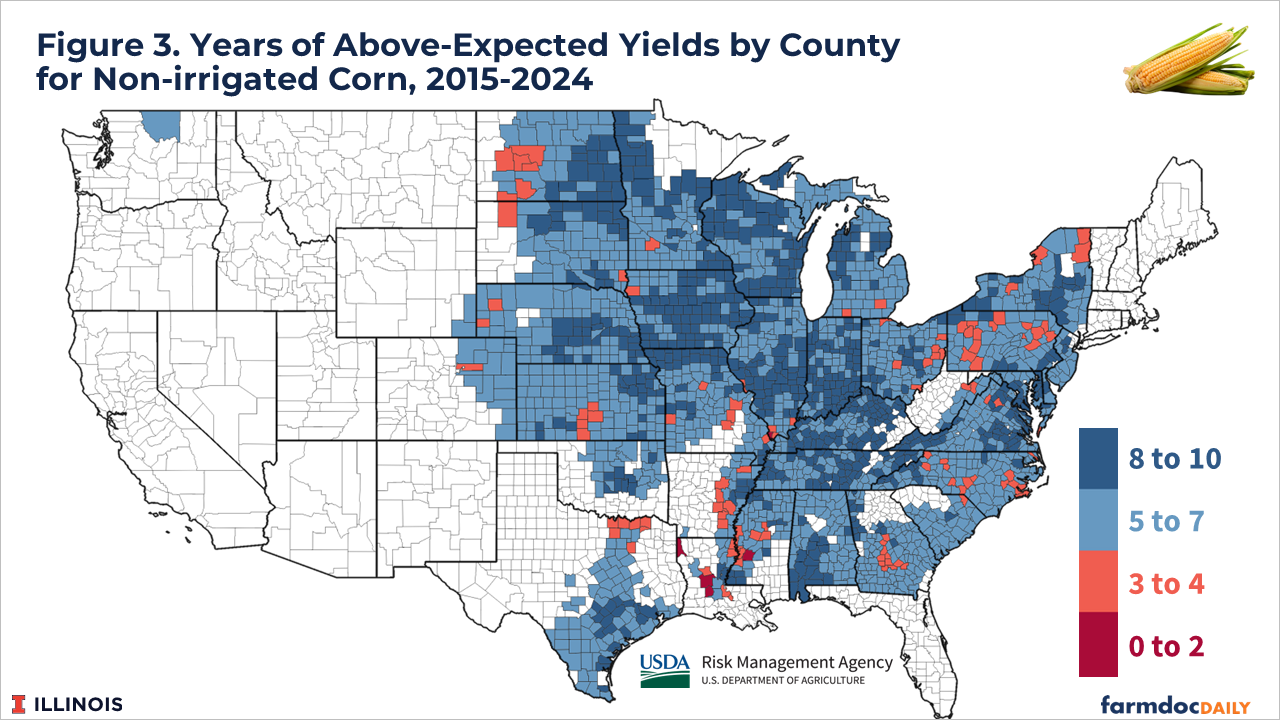
A number of counties, particularly in northern Missouri, Iowa, Illinois, Indiana, and Wisconsin, have had actual yields exceed the expected yield in at least 8 of the 10 years since 2015. Corn and soybean production have benefited from exceptional technological advancements over the last few decades, including improved genetics and seed treatments, crop protection tools, and equipment innovations that have improved the timeliness and accuracy of planting and harvest operations. Overall, RMA expected yield methods have not kept pace with these increases, or have included downward adjustments that do not fully “recover” in periods of higher increases.
Cotton
The experience of cotton-producing areas differs considerably from that of corn and soybeans. Figure 4 provides a specific example of non-irrigated cotton in Dawson County, Texas. Dawson County is a fairly large cotton-producing county. It had the largest enrollment in the non-irrigated STAX insurance program with over 190,000 acres insured using STAX in 2024.
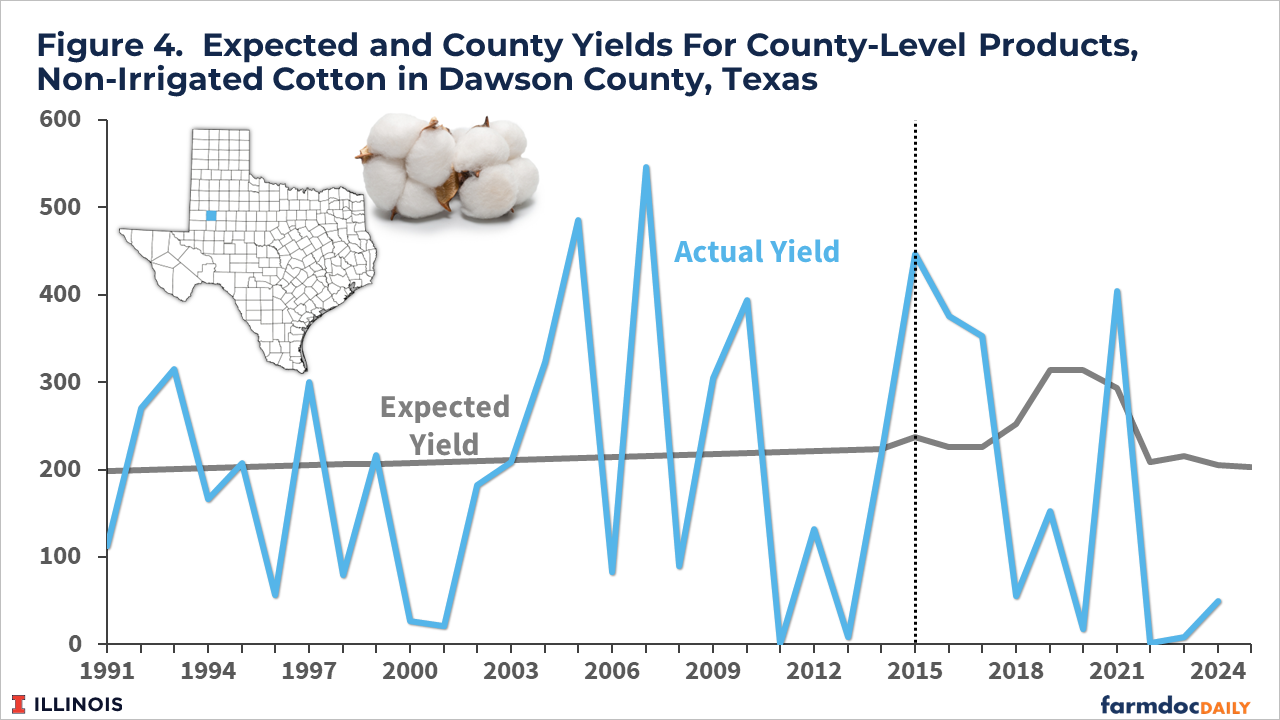
Historically, there has been very little trend in non-irrigated cotton yields in Dawson County and relatively high yield variability. Since 2015, the expected yield for non-irrigated cotton has increased from 226 pounds per acre in 2017 to 314 pounds per acre in 2019, but has been subsequently adjusted downward to 203 pounds per acre for 2025.
Since 2015, the non-irrigated cotton yield in Dawson County exceeded the expected yield 4 times (2015-2017 and 2021) and been below the expected yield 6 times. Figure 5 maps all non-irrigated cotton counties. In contrast with non-irrigated corn and soybeans, the majority of counties have had actual yields below the expected yield in the majority of years since 2015. Actual yields have been above expected yields in 2 or fewer years in many counties across the southeastern cotton-growing region of the US – from Texas to North Carolina. Notably, areas that are more red in figure 5 have much higher historical loss ratios compared to those in blue.
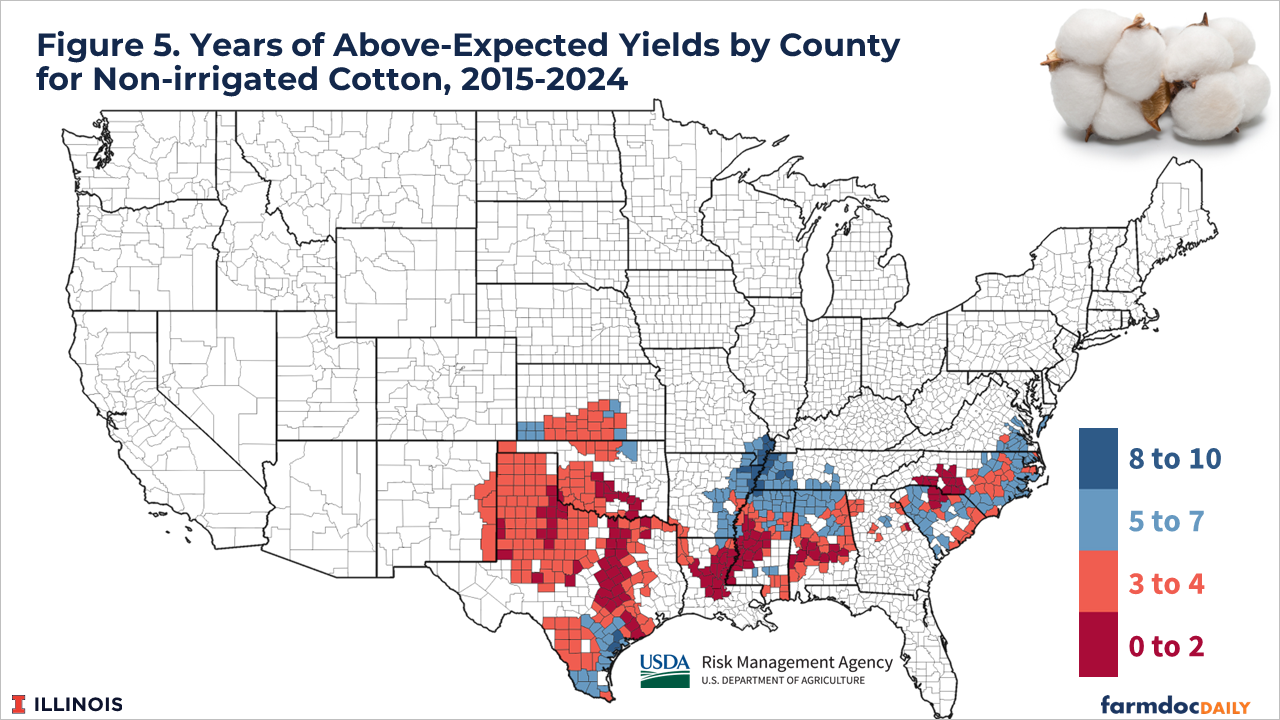
The downward adjustment in the expected yield for non-irrigated cotton in Dawson County reflects recent yield experience and suggests that cotton yields on planted acres may be declining over time. There are also examples of this possible reduction in irrigated cotton as well. Figure 6 shows an example of irrigated cotton in Dooly County, Georgia, a large cotton-producing county. While irrigated cotton yields exhibited a positive trend from 1991-2014, yields appear to be trending down since 2015.
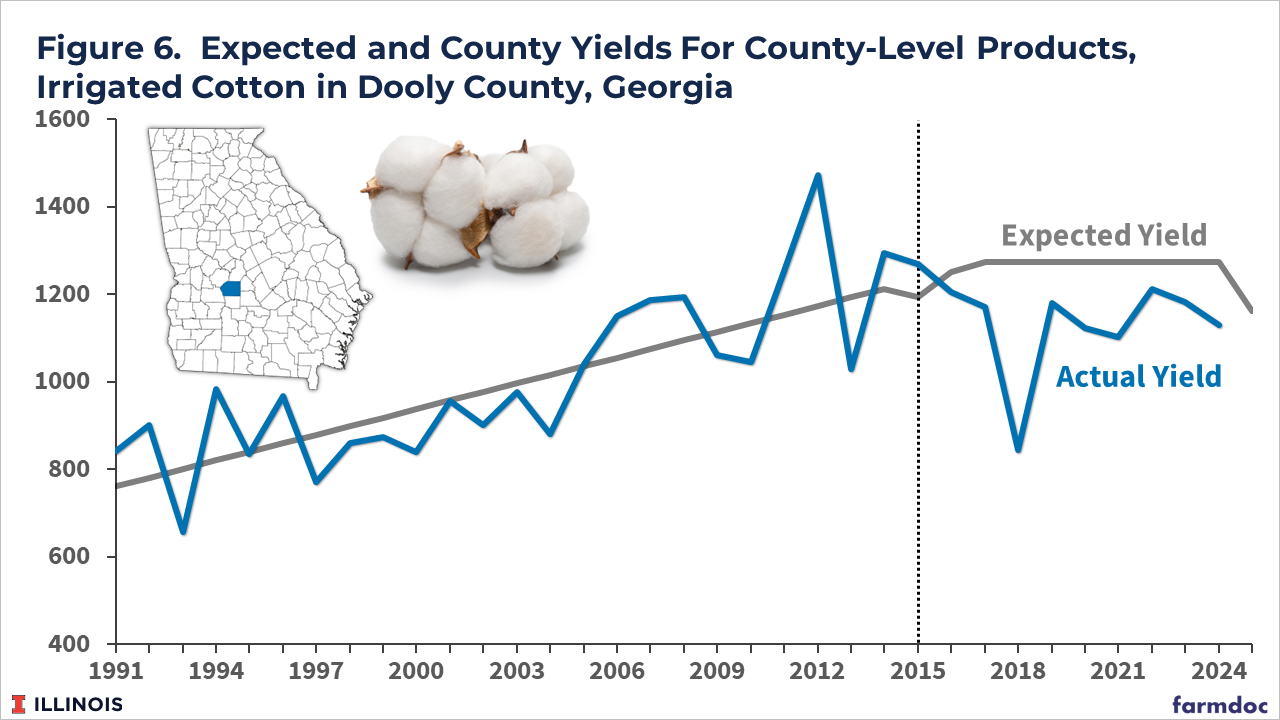
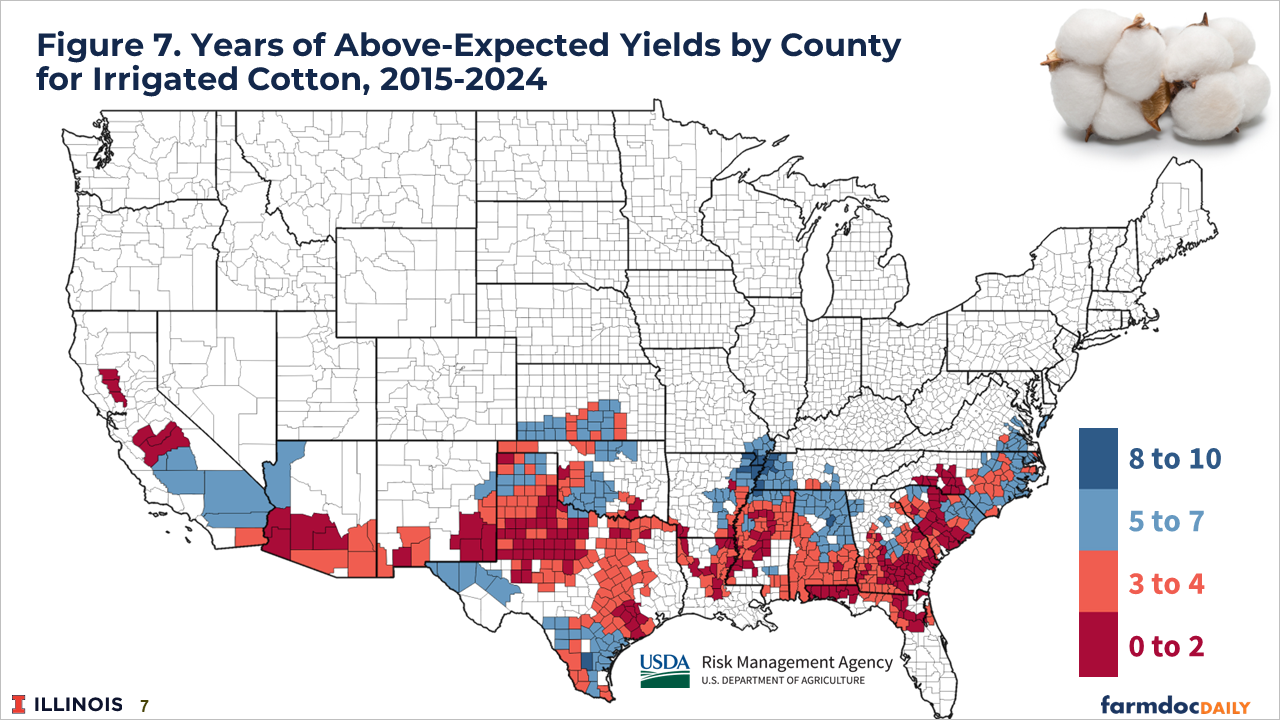
Actual yields were less than the expected yields in Dooly County, Georgia all 10 years since 2015. Figure 7 provides a map of all irrigated cotton counties to provide greater context and a sense of the regional pattern of the relationship between actual and expected yields. The majority of counties have had actual irrigated cotton yields below expected yields in the majority of years since 2015. As with non-irrigated cotton, many counties have not had irrigated cotton yields above the expected yield in more than 2 of the last 10 years. Some counties have never had an actual yield above the insurance-based expected yield.
Implications
Since 2015, the procedures used by RMA to set expected yields have tended to understate non-irrigated corn and soybean yields in most counties. The understatement is particularly meaningful in the Corn Belt region of the Midwest. As a result, county-level products such as SCO and ECO have paid indemnities relatively infrequently in Midwest states (See farmdoc daily, June 10, 2025). On the other hand, expected yields may be over-stated for many cotton-producing counties. As a result, cotton’s STAX program has paid insurance indemnities much more frequently than for the comparable programs available to corn and soybean production (SCO and ECO). Importantly, the target loss ratio for RMA crop insurance programs should be near 1.0 to achieve the goals of actuarial fairness.
Whether the experience of the last 10 years will repeat itself is an open question, but if corn and soybean yields tend to continue to outpace adjustments to expected yields, and the opposite holds true for cotton yields, then county-level product selection and use will suffer from adverse selection issues. Producers in counties facing stable or decreasing yields will be more likely to purchase county-level products than those in areas with increasing county yields, and the loss performance and effective subsidy transfers will follow suit.
Both the current House and Senate versions of the farm bill provisions in the reconciliation bills currently being considered in Congress include enhancements to SCO, including an increase in subsidy support for the program. By its design, SCO will thus provide more support per acre for areas with higher risks. Any existing issues associated with accurately setting expected county yields will exacerbate these payment differences.
References
Schnitkey, G., J. Coppess, N. Paulson, C. Zulauf and B. Sherrick. "Cotton STAX and Modified Supplemental Coverage Option: Concerns with Moving Crop Insurance from Risk Management to Income Support." farmdoc daily (14):111, Department of Agricultural and Consumer Economics, University of Illinois at Urbana-Champaign, June 13, 2024.
Schnitkey, G., B. Sherrick, C. Zulauf, N. Paulson and J. Coppess. "The House Reconciliation Bill Proposal for SCO: Income Support for High-Risk Farmland." farmdoc daily (15):106, Department of Agricultural and Consumer Economics, University of Illinois at Urbana-Champaign, June 10, 2025.
Disclaimer: We request all readers, electronic media and others follow our citation guidelines when re-posting articles from farmdoc daily. Guidelines are available here. The farmdoc daily website falls under University of Illinois copyright and intellectual property rights. For a detailed statement, please see the University of Illinois Copyright Information and Policies here.