


Trillionitus and the US Farm Safety Net
“Trillionitus” is the difficulty in thinking in trillion dollars, a significant constraint when trying to understand the US economy and economic policy. No personal experience is remotely similar in magnitude, but one way to gain some perspective is to compare the US economy and Federal spending to a measure closer to personal experience. This article presents such a comparison using median US household income to provide perspectives on the US farm safety net. The comparison suggests to closely watch whether the writing of the 2025 farm safety net outside the farm bill signals a new pathway for writing the farm safety net.
Federal Spending vs. Median Household Income
US total Federal spending and median US household income had generally similar trends until the COVID 19 pandemic in 2020 (see Figure 1). At present, it is unclear if the trend in Federal spending has changed or is reverting to its pre-COVID-19 trend. Whatever happens to future trends, the magnitudes of these two variables differ. In 2024, total Federal spending was $7.1 trillion while US median household income was $83,730. Median household income is the income at which 50% of US households have higher income and 50% have lower income. The data used to create Figure 1 are from Federal Reserve Economic Data (FRED), Federal Reserve Bank of St. Louis.
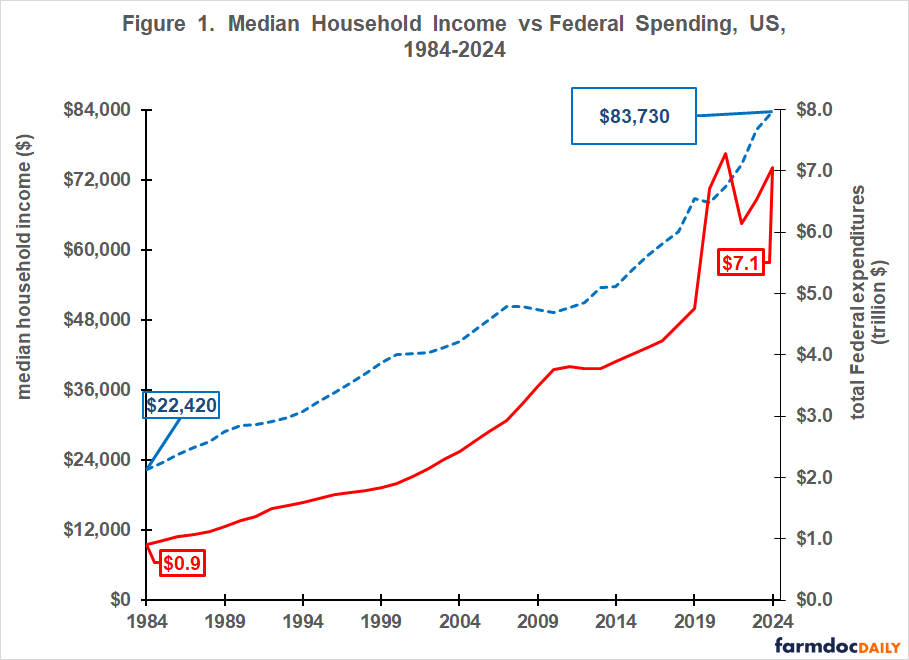
US median household income grew 273% between 1984 and 2024, the first and last year it is available from FRED. This increase exceeded consumer price inflation, which totaled 210% during the same period. Thus, contrary to a common media storyline, inflation-adjusted (i.e. real) median US household income has increased over the last 40 years. Over the same 40 years, US Federal spending grew substantially more, totaling 677%.
US Farm Safety Net
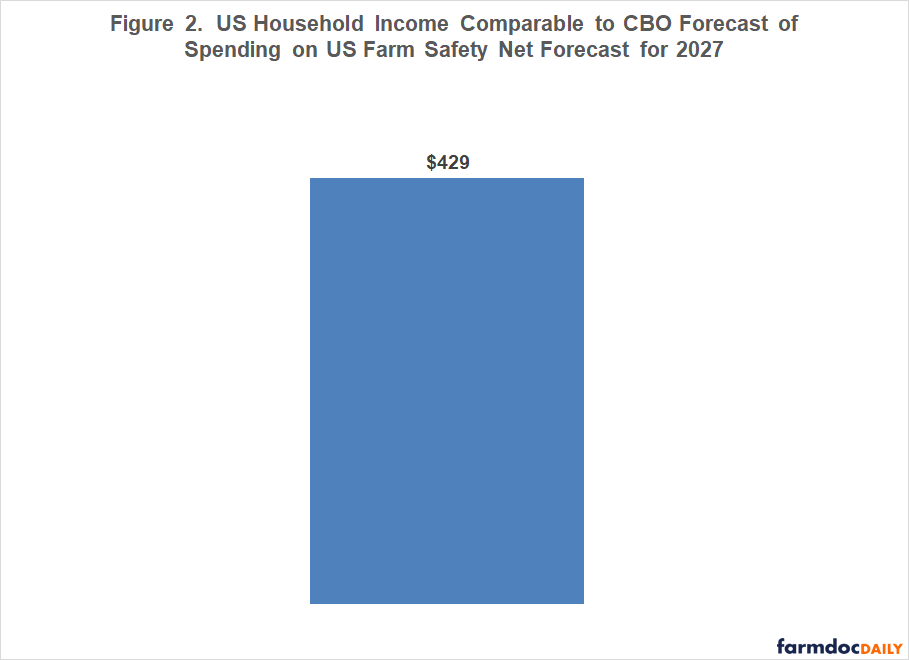
The Congressional Budget Office (CBO) forecasted in February 2026 that spending on US farm safety net programs would total $37.3 billion for the 2027 Federal Fiscal Year (FFY). All changes to the farm safety net authorized by the 2025 Farm Bill in the One Big Beautiful Bill should be implemented by then, including the increase in base acres. The safety net includes commodity programs such as ARC and PLC ($16.3 billion), supplemental disaster assistance ($1.9 billion), and crop insurance ($15.0 billion). If this amount was spent in FFY 2024, it would equal 0.513% of US Federal spending. Applying the same share to median US household income results in $429 of annual household income (0.513% times $83,730) (see Figure 2). Supporters often portray the US farm safety net as an assurance that domestic US food supply will be adequate. To put this in perspective, in 2024 the average US consumer unit spent $575 on ‘life and other personal insurance’ (US Bureau of Labor Statistics), about 35% more than $429.
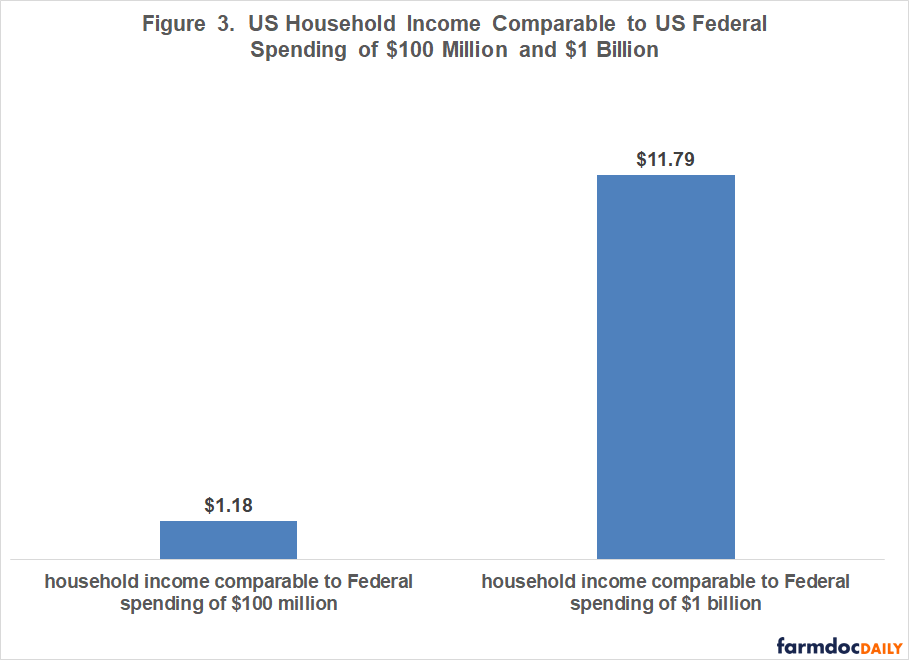
To further place Federal farm safety net spending in perspective, political talk commonly portrays $100 million and $1 billion in annual Federal spending as a large number. However, relative to total US Federal spending, they are very small. Their respective shares of 0.0014% and 0.014% translate into comparative changes in US household income of $1.18 and $11.79 (see Figure 3). These values approach rounding error. Both the dollar amount and its share of the Federal budget have meaning. However, budget share is often the more important, especially in terms of understanding the process of Federal legislation, because it raises this question for a legislator, “Do I want to spend political capital to oppose such a small budget share?”
Discussion
It is important to understand the size of the US economy and US Federal Budget when examining US economic performance and policy formation. One way to gain perspective is to compute comparable changes in a more tangible measure that relates to personal experience, such as median US household income.
Throughout its history, Federal budget constraints have been key determinants of the US farm safety net. However, US farm safety net spending has become such a small share of Federal spending that budget constraints may no longer be as important. This perspective may have prompted writing the 2025 farm safety net in the 2025 One Big Beautiful Bill, i.e. authorize relatively large spending increases for a program with a relatively small budget share in a much bigger budget bill.
Time will tell if a new pathway for writing the farm safety net is emerging and what the political and economic consequences will be if the new pathway becomes the norm. The process used for the 2025 farm safety net may be a pivot point in the history of US support for farmers, a possibility that bears close watching.
References
Federal Reserve Bank of St. Louis. September 2025. Federal Reserve Economic Data. https://fred.stlouisfed.org
US Bureau of Labor Statistics. December 19, 2025. Consumer Expenditures – 2024. USDL-25-1585. https://www.bls.gov/news.release/cesan.nr0.htm
US Congressional Budget Office. February 2026. CBO’s February 2026 Baseline for Farm Programs. https://www.cbo.gov/system/files/2026-01/51317-2026-02-usda.pdf
Disclaimer: We request all readers, electronic media and others follow our citation guidelines when re-posting articles from farmdoc daily. Guidelines are available here. The farmdoc daily website falls under University of Illinois copyright and intellectual property rights. For a detailed statement, please see the University of Illinois Copyright Information and Policies here.