








A Pre- and Post-Report Look at the 2026 U.S. Soybean Yield
The USDA’s August Crop Production report, released on August 12, 2026, included the first survey-based yield forecast for soybeans of the season, along with the corn estimate mentioned in last week’s article (see farmdoc daily article from August 12, 2026). Similar to the corn estimates, the August soybean forecast is based on the USDA’s Agricultural Yield Survey, which relies on farmer-reported field conditions. In contrast, the Objective Yield Survey, which counts physical plants and pods, will not begin field work until late August and will not contribute to the USDA’s forecast until the September report.
This article presents an independently constructed, condition-based forecast of the 2026 U.S. soybean crop and compares it to what USDA reported. The forecasting approach is identical in structure to the corn model described last week: a state-level trend-and-condition regression, applied separately to each of 18 leading soybean-producing states, using USDA NASS’s weekly crop condition ratings. Readers who reviewed last week’s corn article will recognize the methodology; it is not repeated in full detail here.
A note on timing: this article’s current estimate is built from crop condition data through August 16, 2026 (crop week #33), which USDA released after its August 12 Crop Production report. That sequencing matters for how the comparison below should be read and is addressed directly in the next section.
The Pre-Report Baseline and This Week’s Update
Two distinct model readings are relevant to a fair comparison against USDA’s August number. The first is the forecast as it stood immediately before the report, using condition data through August 9 (crop week #32), the last update made with no knowledge of what USDA would report. That pre-report forecast put the national soybean yield at 53.5 bu/ac, on harvested acreage of 84,401 thousand acres carried over from the June Acreage report, for predicted production of 4,513 million bushels.
The second reading is this week’s update (crop week #33), which incorporates a new round of USDA NASS condition data released August 16, four days after the Crop Production report. That new condition data was collected and compiled independently of USDA’s yield survey, a separate NASS data product on a separate schedule, so this week’s forecast is not a reaction to USDA’s number even though it happens to follow it chronologically. This week’s national estimate stands at 53.4 bu/ac, which is effectively unchanged from the pre-report figure. This modest signal suggests that the model’s within-season trajectory was not disrupted by the report’s release. Harvested acreage now reflects USDA’s official August estimate of 85,781 thousand acres, up from the June figure, for a current production estimate of approximately 4,584 million bushels. For comparison, the final 2025 U.S. soybean yield was 53.0 bu/ac on 80,437 thousand harvested acres, for total production of 4,262 million bushels.
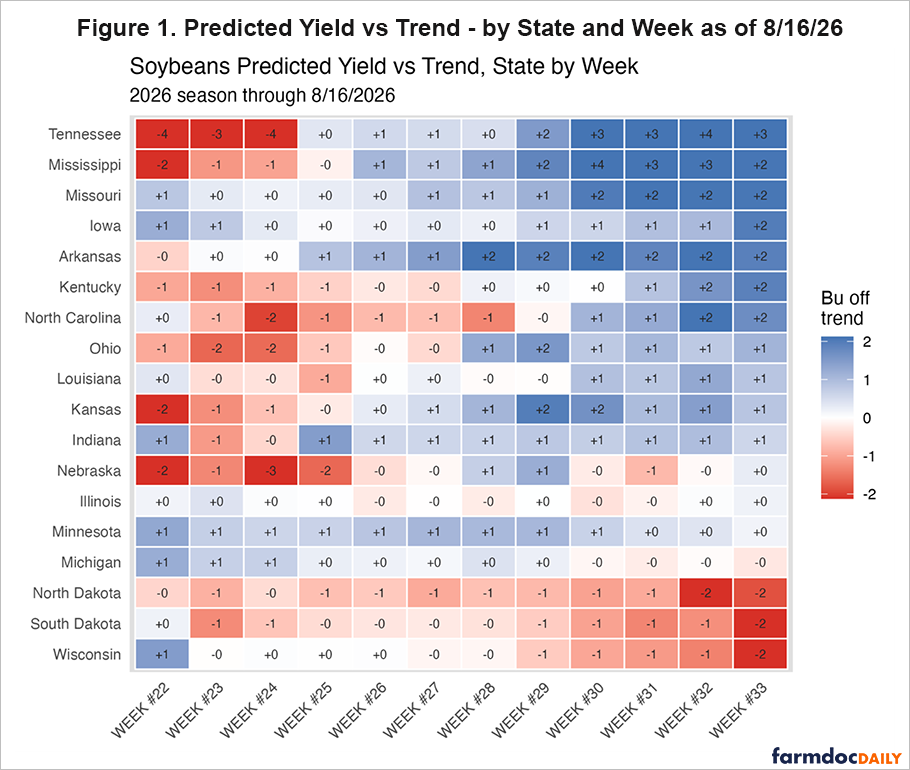
Figure 1 tracks each state’s predicted yield relative to its own long-run trend line across the season, through this week’s update. Two trajectories stand out. Tennessee moved from 4 bu/ac below trend in late May to 3-4 bu/ac above trend by mid-August, one of the more pronounced turnarounds in the model. Wisconsin and North Dakota moved in the opposite direction, both drifting to their worst below-trend readings of the season this week. However, North Dakota’s soybean model carries a weak fit, with an R-squared of 0.19, and its within-season signal deserves limited weight on that basis alone.
Comparing the Model to USDA
The USDA’s August report estimates the national soybean yield at 52.7 bushels per acre, with harvested acreage totaling 85,781 thousand acres. This results in a total production of 4,519 million bushels, reflecting a 6.0% increase from the 2025 production of 4,262 million bushels. The increase is primarily attributed to a 6.6% rise in harvested acreage. Meanwhile, the yield has remained relatively unchanged from last year, with a slight decrease of 0.6%. Additionally, the harvested acreage estimate was revised upward by 1.6%, which is a larger proportional increase than corn’s 1.3% revision.
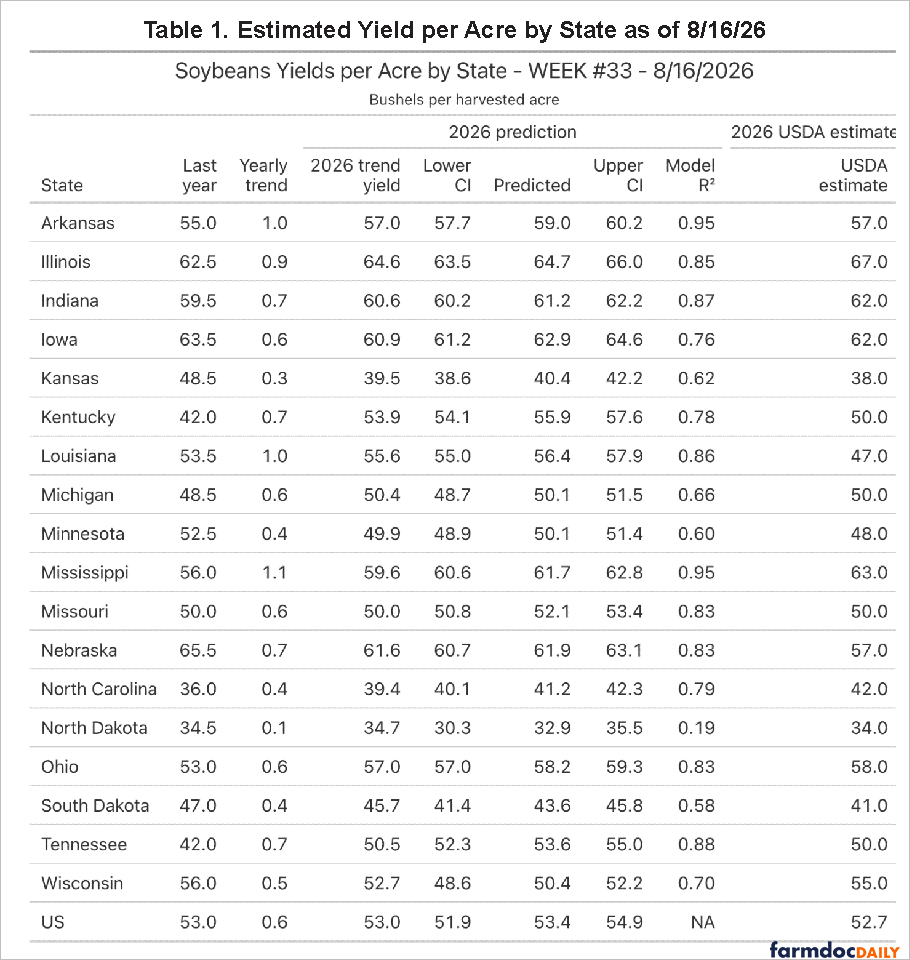
Measured against the pre-report baseline, recalculated on USDA’s updated acreage, the model’s 53.5 bu/ac ran about 0.8 bu/ac above USDA’s 52.7. Measured against this week’s current forecast, the gap is 0.7 bu/ac (1.3%), essentially the same reading either way, which reinforces the point made above: this week’s update did not converge toward USDA’s number after the fact, it was already close to where the pre-report forecast stood. In production terms, the current model estimate of roughly 4,584 million bushels runs about 65 million bushels (1.4%) above USDA’s 4,519 million. That national gap is narrower than corn’s comparable 1.2% yield gap reported last week, and well within the range of ordinary early-season forecast uncertainty.
Table 1 allows a state-by-state comparison using this week’s figures and, as with corn, the state-level detail is more informative than the national gap. Several states lined up closely: Ohio (model 58.2, USDA 58.0), Michigan (50.1 versus 50.0), and Missouri (52.1 versus 50.0) all came within roughly two bushels. Others diverged more sharply. Louisiana showed the largest gap in either crop this week, with the model’s 56.4 bu/ac running 9.4 bu/ac above USDA’s 47.0, despite a reasonably strong model fit (R-squared of 0.86). Kentucky (5.9 bu/ac too high), Nebraska (4.9 too high), and Tennessee (3.6 too high) were the other notable overestimates. In the opposite direction, the model ran low relative to USDA in Wisconsin (4.6 bu/ac) and Illinois (2.3 bu/ac).
An Echo From the Corn Comparison
Two of these states warrant particular attention because they reproduce a pattern documented in last week’s corn analysis. Nebraska and Tennessee both showed the corn model running meaningfully above USDA’s August number, and both show the identical direction and a comparable magnitude in the soybean model this week. These are separate models, estimated independently by crop, so a shared miss on the same two states in the same week is a more informative signal than either miss considered alone. The text implies that there is something significant about the actual conditions in those states this season or how those conditions were reported and interpreted in relation to the historical data that each model depends on. This divergence seems to stem from the condition ratings history rather than being a specific issue with the crop modeling itself.
The trend-deviation evidence in Figure 1 offers a partial, but not complete, explanation. Wisconsin’s pattern is consistent with the lesson drawn from corn’s largest misses last week: it carried the most extreme below-trend reading on the board heading into the report, and it was also one of the model’s two largest underestimates relative to USDA. Louisiana and Kentucky do not fit that pattern as cleanly. Neither was running especially far from its own trend line before the report, yet both produced two of the three largest misses in the state-level comparison. An extreme within-season trend deviation appears to be one useful flag for where a bigger miss is more likely, based on this week’s evidence, but it is evidently not the only factor at work, and readers should not treat it as a complete explanation.
Are Soybeans More Sensitive to Late-Season Weather Than Corn?
One pattern worth flagging, though it is offered here as a hypothesis rather than a settled finding, comes from comparing model fit across the two crops directly, using the full state-level tables from the same week (week 32, August 9, 2026). Of the 15 states tracked in both the corn and soybean models, corn’s current-season R-squared is higher than soybean’s in all 15, without exception:
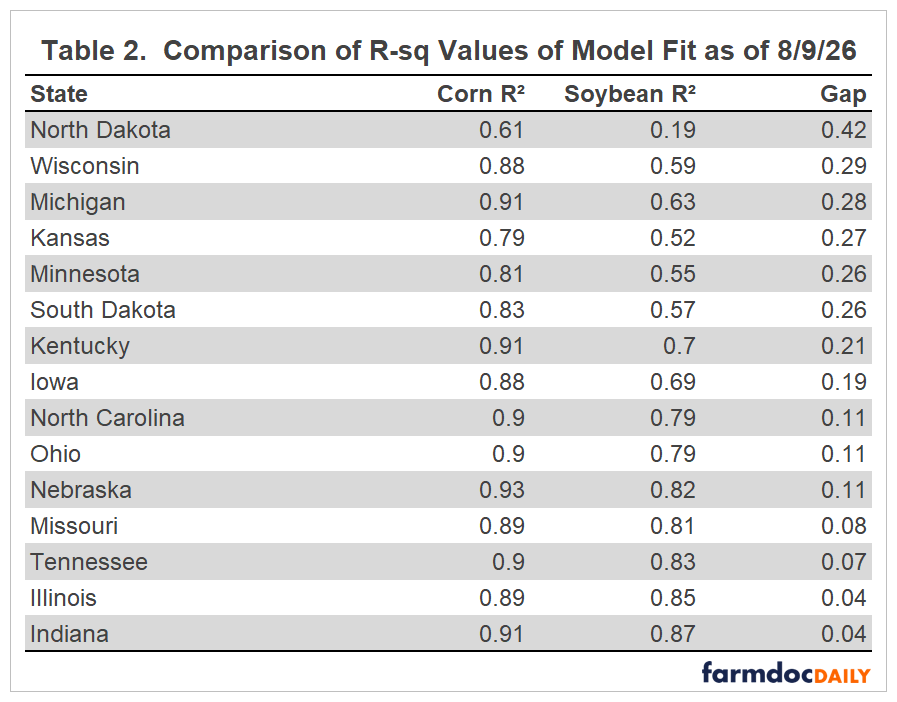
Averaged across all 15 states, corn’s R-squared runs 0.86 against soybean’s 0.68, a gap of about 0.18. That corn’s fit is not just higher on average, but higher in every single comparable state this season, is a much stronger pattern than a handful of scattered examples would suggest, and it is unlikely to be coincidental.
A lower R-squared means that, as of mid-August, the season’s condition ratings explain less of the eventual yield outcome for soybeans than they do for corn in the same state. One plausible explanation is that soybeans, which typically fill pods later into the season than corn fills kernels, remain more exposed to weather that had not yet occurred when this week’s condition ratings were taken. If that interpretation is correct, it would suggest soybean yield outcomes are more sensitive to late-season (roughly late August through September) weather than corn outcomes are, at the same point in the calendar, and that a meaningful share of this year’s eventual soybean outcome is still being determined by weather yet to come. That interpretation is consistent with a unanimous pattern across all 15 comparable states, but it is not proven by it; a lower soybean R-squared could also reflect other factors, such as a shorter or noisier historical training record in some soybean states or systematic differences in how condition ratings translate to yield between the two crops generally. Given how consistent the pattern is, though, it is a stronger candidate for follow-up analysis than a partial sample would have suggested.
How Much Weight Should the August Number Carry?
Last week’s companion analysis (Ibendahl, 2026) quantified USDA’s historical August forecast accuracy for corn specifically, finding a standard deviation of about 5.3 bu/ac (roughly 3% at trend yield) against the eventual final yield, with a documented tendency for August misses to persist substantially into the September and October reports rather than fully correct. A parallel historical accuracy analysis has not yet been conducted for soybeans, and the corn results should not be assumed to transfer directly. The R-squared comparison above, a complete, unanimous gap across all 15 directly comparable states, is a specific and fairly strong reason to expect soybeans to carry more late-season forecasting risk than corn does at this point in the season, not merely a general caution. That analysis is a natural extension of this work and is planned for a future article.
In the absence of a soybean-specific accuracy benchmark, the corn results offer a reasonable, if imperfect, prior: a roughly 1.3% gap between an independent condition-based estimate and USDA’s August survey is modest by the standard corn has historically shown, though the R-squared pattern documented above argues for meaningfully more caution than the corn comparison alone would suggest, particularly for any single state’s number rather than the national aggregate.
Concluding Comments
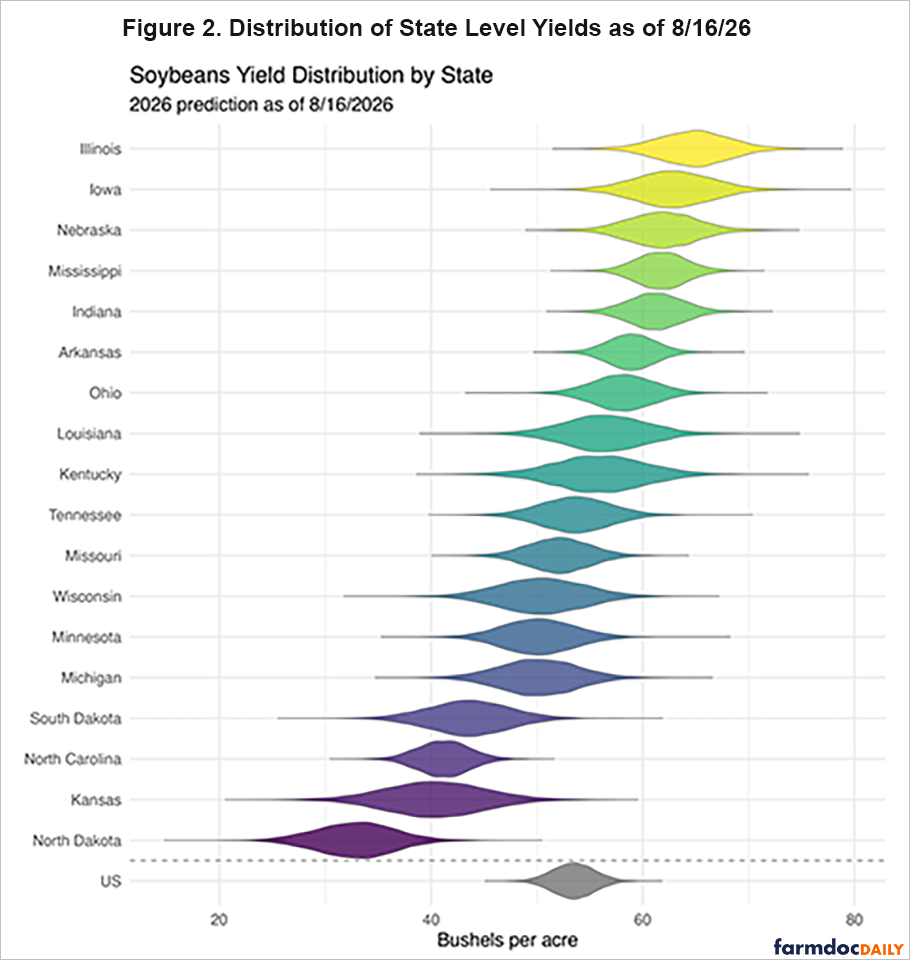
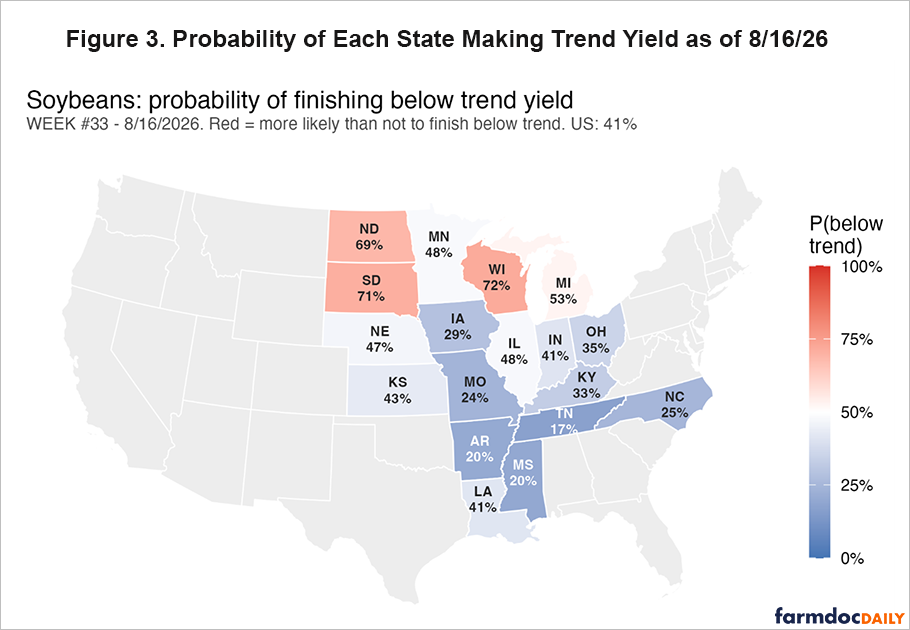
Figure 2 places the full predicted yield distribution for each state, and for the nation, side by side; Illinois and Iowa remain the two highest-yielding large states, and the national distribution (shown separately at the bottom) sits comfortably within the range implied by the individual state distributions above it. Figure 3 shows the current state-level probability of finishing below trend: Wisconsin (72%) and South Dakota (71%) carry the highest odds nationally, both consistent with the below-trend deterioration shown in Figure 1, while Tennessee (17%) and Mississippi (20%) sit among the lowest, consistent with their late-season improvement. The national figure stands at 41%, essentially unchanged over the past two weeks and comfortably below corn’s comparable 66% reported last week, a difference that continues to track the broader divergence between a soybean crop working from more acres than last year and a corn crop working from fewer.
The acreage revision, larger proportionally for soybeans than for corn, did more to move this week’s production outlook than any change in the underlying yield forecast, which barely moved before and after the report. The national gap between the condition-based model and USDA’s August survey is modest in both crops, but the state-level detail is where this comparison earns its keep: Nebraska and Tennessee missed in the same direction in both crops this week, Wisconsin’s extreme below-trend reading anticipated one of the larger misses in the soybean comparison, and the consistently weaker fit of the soybean model relative to corn, present in all 15 directly comparable states, is a real and worth-tracking sign that soybeans carry more unresolved late-season weather risk at this point in the calendar. Both crops will be watched closely against September’s report, which will be the first to incorporate USDA’s physical field measurements.
Note: This is a companion piece to last week’s farmdoc daily article on the 2026 corn yield forecast. The full weekly soybean forecast series, including all state-level tables and the complete set of 17 supporting figures, is published at agricultural.substack.com.
References
Full weekly estimation history for both corn and soybeans, including all state-level tables and the complete set of 17 supporting figures per crop, is available at agricultural.substack.com.
Ibendahl, G. "A Pre- and Post-Report Look at the 2026 U.S. Corn Yield." farmdoc daily (16):144, Department of Agricultural and Consumer Economics, University of Illinois at Urbana-Champaign, August 12, 2026.
Ibendahl, G. “How Much Should You Trust USDA’s August Corn Number? Here’s 30 Years of Evidence.” Agricultural Economics (Substack), August 10, 2026. https://agricultural.substack.com/p/how-much-should-you-trust-usdas-august
Disclaimer: We request all readers, electronic media and others follow our citation guidelines when re-posting articles from farmdoc daily. Guidelines are available here. The farmdoc daily website falls under University of Illinois copyright and intellectual property rights. For a detailed statement, please see the University of Illinois Copyright Information and Policies here.