








Agricultural Lending by Commercial Banks: 2026 Second Quarter
Agricultural loan balances at U.S. commercial banks increased in the second quarter of 2026, with gains in both farm real estate and non-real estate loans. At agricultural banks, farm loan delinquency rates declined from the previous quarter but remained close to their year-earlier levels. Net interest margins widened as yields on earning assets increased while funding costs remained relatively steady.
In today’s article, we examine agricultural lending activity, loan quality, and bank profitability in the second quarter of 2026 using Federal Deposit Insurance Corporation (FDIC) Call Report data (see FDIC and Federal Reserve Bank of Kansas City). Our analysis is limited to commercial banks with outstanding agricultural loans and gives particular attention to agricultural banks. These are banks specialized in agricultural lending, most of which are community banks, and are defined as banks whose combined farm real estate and non-real estate farm loans account for at least 25% of gross loans and leases.
Agricultural Lending Activity
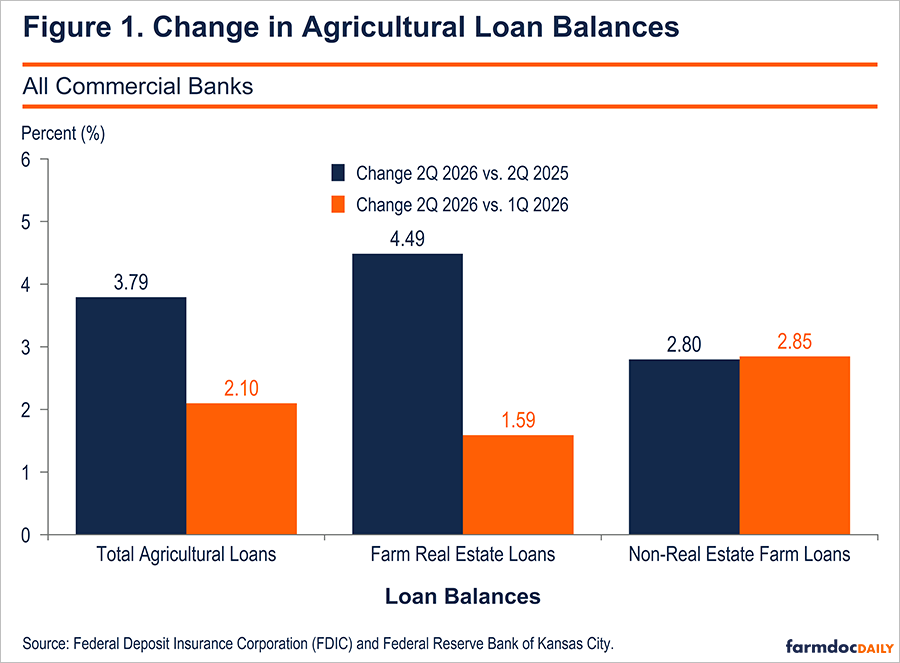
Total agricultural loans at commercial banks reached $206.27 billion in the second quarter, up $4.24 billion (2.10%) from the first quarter and $7.54 billion (3.79%) from a year earlier (Figure 1).
These agricultural loans consist of farm real estate and non-real estate farm loans. Farm real estate loans are secured by farmland, including farm residences and other improvements. Non-real estate farm loans finance agricultural production and other borrowing by farmers, including equipment and livestock purchases. Together, these balances measure loans outstanding at quarter-end, rather than new loans issued during the quarter.
As shown in Figure 1, outstanding farm real estate loans at commercial banks increased 1.59% from the previous quarter and 4.49% from a year earlier, reaching $122.26 billion. Outstanding non-real estate farm loans increased 2.85% during the quarter and 2.80% over the year to $84.00 billion.
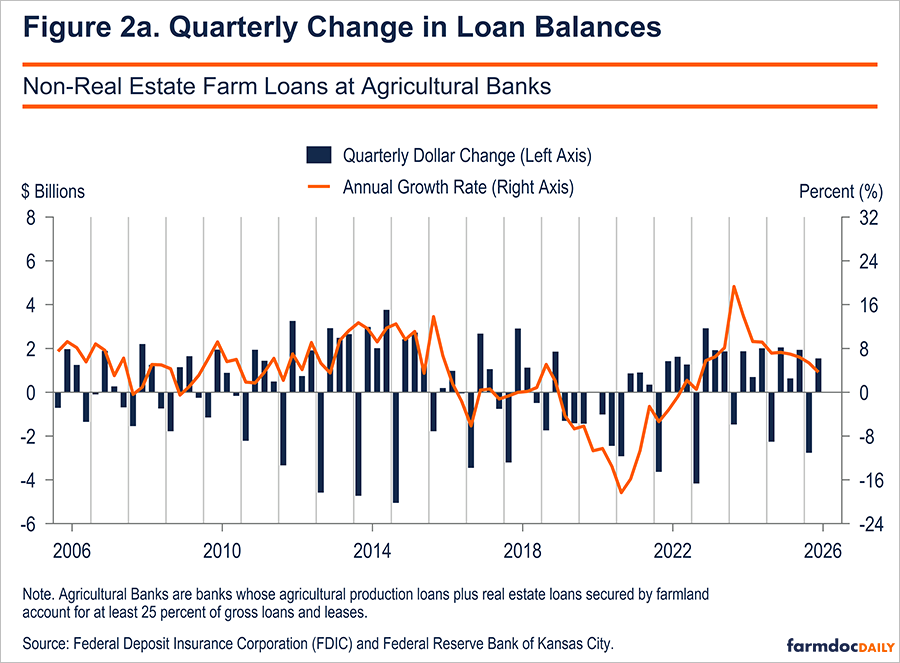
Agricultural banks held $86.92 billion in total farm loans in the second quarter, representing approximately 42% of the total outstanding farm loans at commercial banks. Their non-real estate balances increased $1.55 billion (4.23%) during the quarter to $38.12 billion, following a $2.77 billion (7.03%) decline in the first quarter (Figure 2a). Annual growth continued to slow, falling from 5.35% in the first quarter to 3.68% in the second. This was also below the 7.29% annual growth reported in the second quarter of 2025.
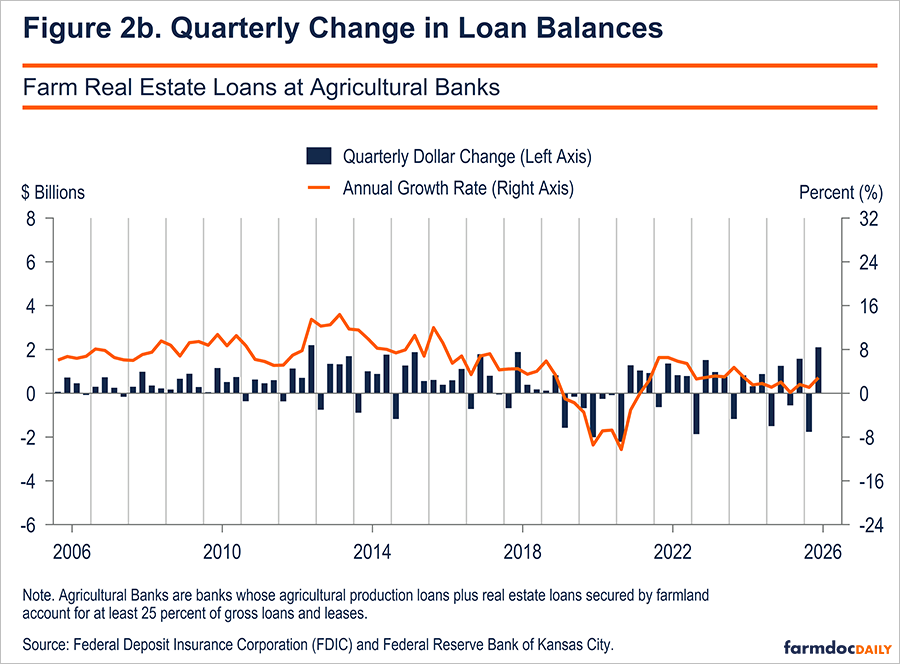
Farm real estate loans at agricultural banks increased $2.10 billion or 4.50 percent during the quarter to $48.80 billion, following a $1.77 billion (3.65%) decline in the first quarter (Figure 2b). Additionally, annual growth accelerated from 1.10% in the first quarter to 2.85% in the second.
Farm Loan Delinquency
Figure 3 shows the share of agricultural banks’ farm loans that are delinquent. This includes loans at least 30 days past due and still accruing interest, together with loans in nonaccrual status. Banks generally stop accruing interest on loans when collection of principal or interest is in doubt. Higher delinquency rates indicate that a larger share of outstanding loan balances is experiencing repayment problems.
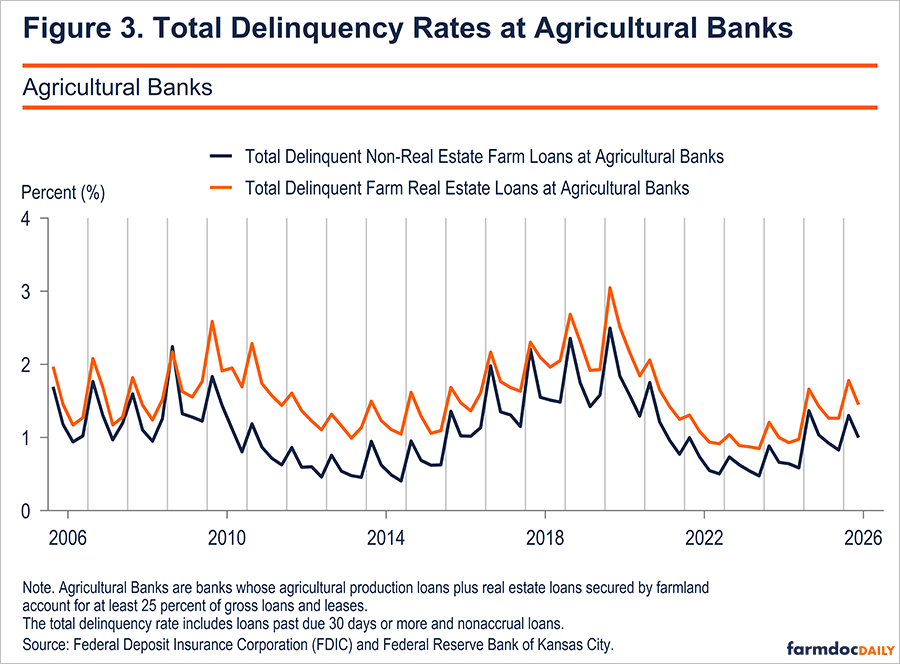
In the second quarter, the delinquency rate for non-real estate farm loans declined by 30 basis points to 1.00% from 1.30% in the first quarter. The farm real estate delinquency rate also declined, falling by 33 basis points to 1.45% from 1.78%.
Compared with a year earlier, however, delinquency rates were relatively unchanged, and both rates remained below their most recent peaks in the first quarter of 2020. For example, the non-real estate delinquency rate was approximately 4 basis points below its second-quarter 2025 level of 1.03%, while the farm real estate rate was approximately 2 basis points above its earlier level of 1.43%.
Net Interest Margin
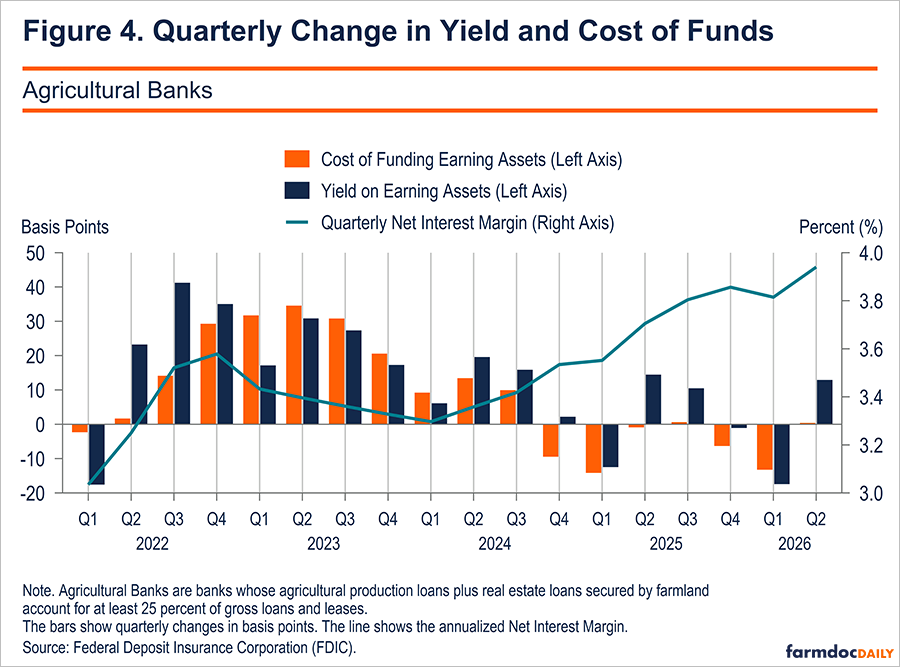
Net Interest Margin (NIM) is defined as the difference between the Yield on Earning Assets (YEA) i.e., the total interest, dividend, and fee income earned on loans, securities, and other investments as a share of average earning assets, and the Cost of Funding Earning Assets (COF) i.e., the total interest expense on deposits and other borrowings as a percentage of average earning assets.[1] Moreover, NIM is a measure of bank profitability and tells us how well it manages the spread between what it earns on assets that generate income and what it pays to fund those assets. Thus, what drives the NIM are changes in the YEA and COF.
As shown in Figure 4, the NIM for agricultural banks increased approximately 13 basis points from the first quarter to 3.94%. The Yield on Earning Assets rose approximately 13 basis points to 5.75%, while the Cost of Funding Earning Assets increased less than one basis point to 1.81%. Higher yields on earning assets accounted for nearly all the quarterly increase in NIM in the period.
Compared with a year earlier, NIM was approximately 23 basis points higher in the second quarter. Lower funding costs in Q2 of 2026 accounted for most of this increase: funding costs declined approximately 19 basis points from 2.00%, while yields on earning assets increased 4.88 basis points from 5.71%.
Summary
Outstanding agricultural loan balances continued to grow in the second quarter of 2026. Farm real estate loans accounted for most of the annual increase across commercial banks. At agricultural banks, both farm real estate and non-real estate farm loans increased after first-quarter declines. Moreover, annual growth slowed for non-real estate loans but accelerated for farm real estate loans.
Loan performance at agricultural banks improved from the first quarter, but delinquency rates remained close to their year-earlier levels.
Agricultural banks also earned a wider net interest margin in the second quarter. Higher yields supported the quarterly increase, while lower funding costs accounted for most of the improvement over the year. Together, these results show continued loan growth and stronger interest margins, with relatively little annual change in farm loan delinquency rates.
Note
[1] Earning assets are all loans and other investments that earn interest or dividend income.
Disclaimer: We request all readers, electronic media and others follow our citation guidelines when re-posting articles from farmdoc daily. Guidelines are available here. The farmdoc daily website falls under University of Illinois copyright and intellectual property rights. For a detailed statement, please see the University of Illinois Copyright Information and Policies here.