








Seed, Fertilizer, and Pesticide Costs: Comparing U.S. and Brazilian Soybean Farms
The September 2026 Purdue University–CME Group Ag Economy Barometer found that 80% of producers were concerned or very concerned about the competitiveness of U.S. soybeans relative to Brazil. In the same survey, a record 52% of respondents named high input costs their biggest concern (Langemeier and Colussi, 2026). Brazil and the United States together accounted for almost 70% of global soybean production in 2025/26, with shares of 42% and 27%, respectively (USDA, 2026).
Since the U.S.–China trade dispute began in 2018, China has increasingly turned to Brazil for its soybean supplies (Colussi and Langemeier, 2025). That shift was especially clear in 2025, when Chinese purchases of U.S. soybeans fell sharply (Gardner, 2025). The trade numbers reflect it, with Brazil exporting a record 115 million metric tons of soybeans in the 2025/26 marketing year, 61% of global trade, and the U.S. just 41.4 million metric tons (Valdes et al., 2026).
Soybean farmers in both countries have little control over the prices they receive. Because individual farms sell in the same global market, their ability to compete depends largely on how much it costs them to produce a crop. This article compares what nine typical farms in the U.S. and Brazil spent on seed, fertilizer, and pesticides over five years, showing where input costs differ between the two countries and discussing factors that may explain those differences.
Methods and Data
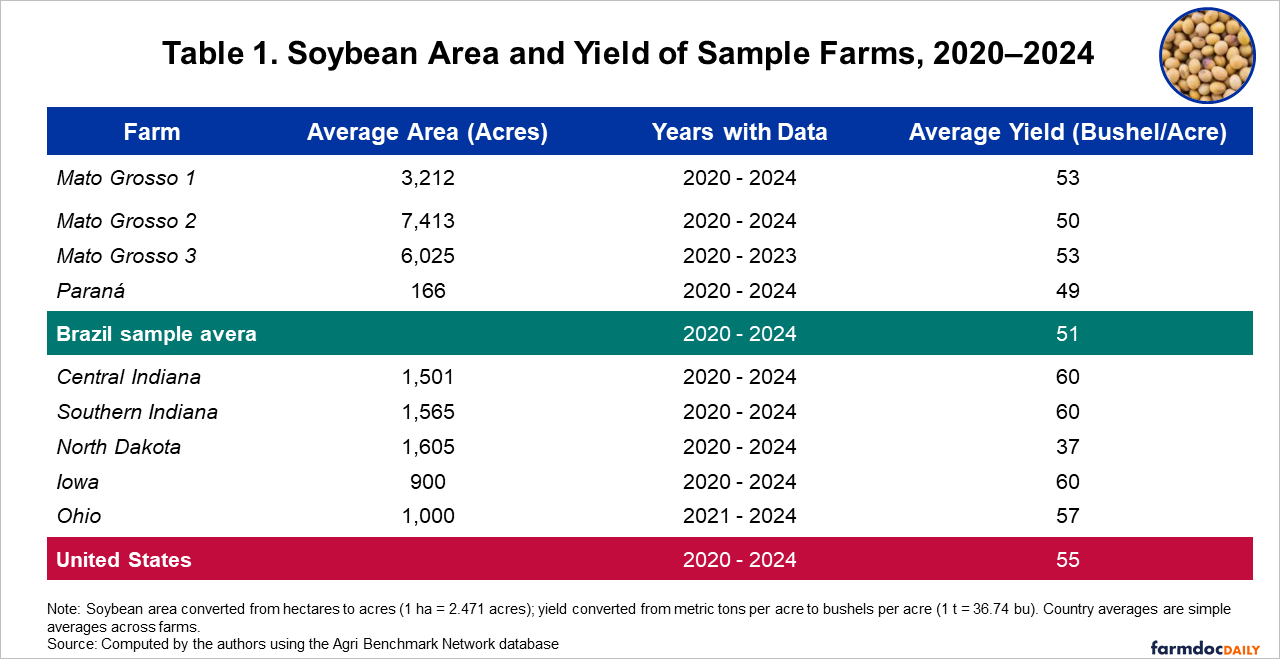
To compare input costs across the two countries, we use typical-farm data from the agri benchmark network, developed using standardized procedures to represent prevailing commercial production systems and farm structures in major producing regions (Langemeier, 2024). The sample is four soybean farms in Brazil (three in Mato Grosso and one in Paraná) and five in the United States (two in Indiana and one each in Iowa, North Dakota, and Ohio). Data cover 2020–2024, except for Mato Grosso 3 (2020–2023) and Ohio (2021–2024). The study period spans both the COVID-19 pandemic and the input-price surge after Russia’s invasion of Ukraine.
Farm sizes vary considerably, but soybean yields are relatively similar across the two countries (Table 1). Brazilian farms averaged 51 bushels per acre, compared with 55 bushels on U.S. farms. The U.S. average was pulled down by the North Dakota farm, which averaged just 37 bushels per acre.
Total Production Costs: Land Drives the U.S.–Brazil Gap
Figure 1 shows how total costs divide into agri benchmark’s three categories: (i) Direct costs (seed, fertilizer, pesticides, crop insurance, irrigation, drying, and interest on input financing), (ii) Operating costs (machinery, labor, fuel, and contractors), and (iii) Overhead costs (land, buildings, and miscellaneous). From 2020 to 2024, U.S. farms spent more per acre than Brazilian farms in every year, $616 versus $416 on average (Figure 1).
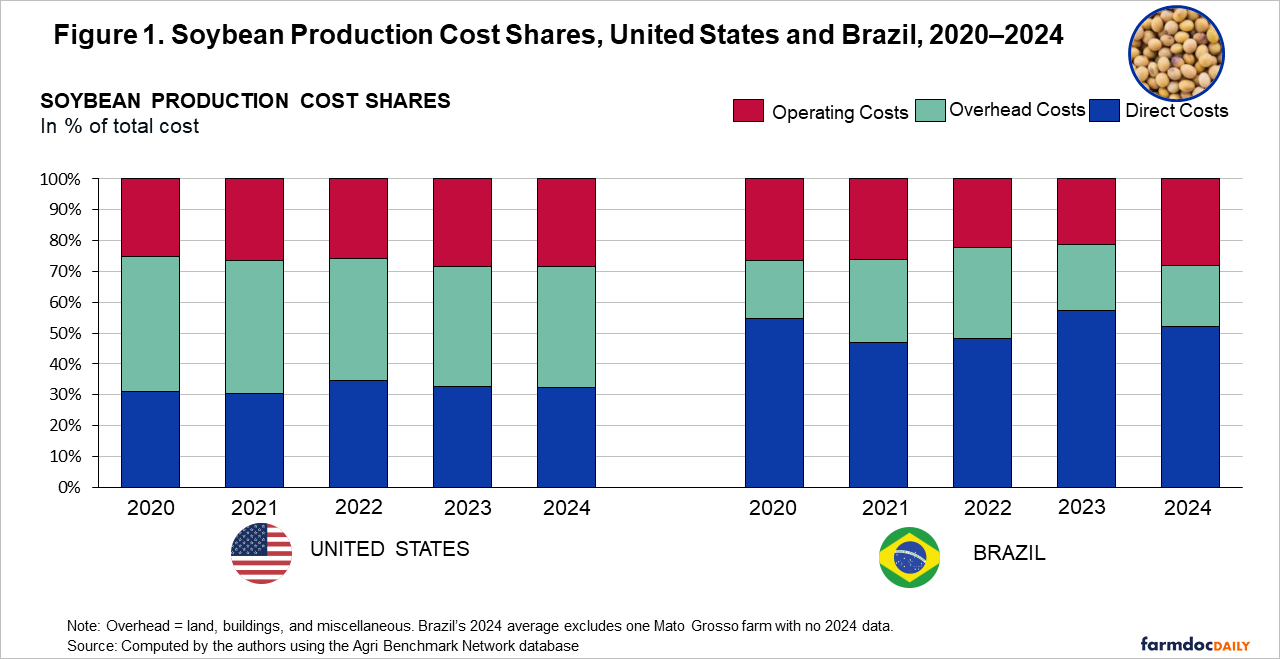
Most of the gap in total soybean production costs comes from overhead, mainly land, which accounted for about 40% of U.S. costs but 19% to 30% of Brazilian costs. Direct costs show the opposite pattern: they accounted for about half of Brazilian costs (47% to 57%) but about one-third of U.S. costs (30% to 35%). Average direct costs were similar across the sample farms in both countries, at $218 per acre in Brazil and $200 in the United States, but this average hides how differently those costs are built and how they moved over time. Seed, fertilizer, and pesticides make up 96% of direct costs in Brazil and 90% in the United States, so the rest of this article focuses on these three main inputs.
Higher Fertilizer Costs and Import Dependence in Brazil
Brazilian farms spent more on fertilizer than U.S. farms in every year analyzed, $85 versus $57 per acre on average (see Figure 2). The difference reflects both how much Brazilian farms apply and what they pay for it. The acidic, nutrient-poor soils of Brazil’s Cerrado require large amounts of fertilizer and lime. Brazil is the world’s largest fertilizer importer. It imports about 72% of its phosphate and 96% of its potash, compared with 16% and 95% in the United States. These imports must then be trucked to the main producing regions of the Brazilian Center-West (Valdes et al., 2026). Among the farms in our sample, these two nutrients make up about 95% of fertilizer costs in both countries, and the gap comes mostly from phosphorus, where Brazilian farms spent about twice as much as U.S. farms.
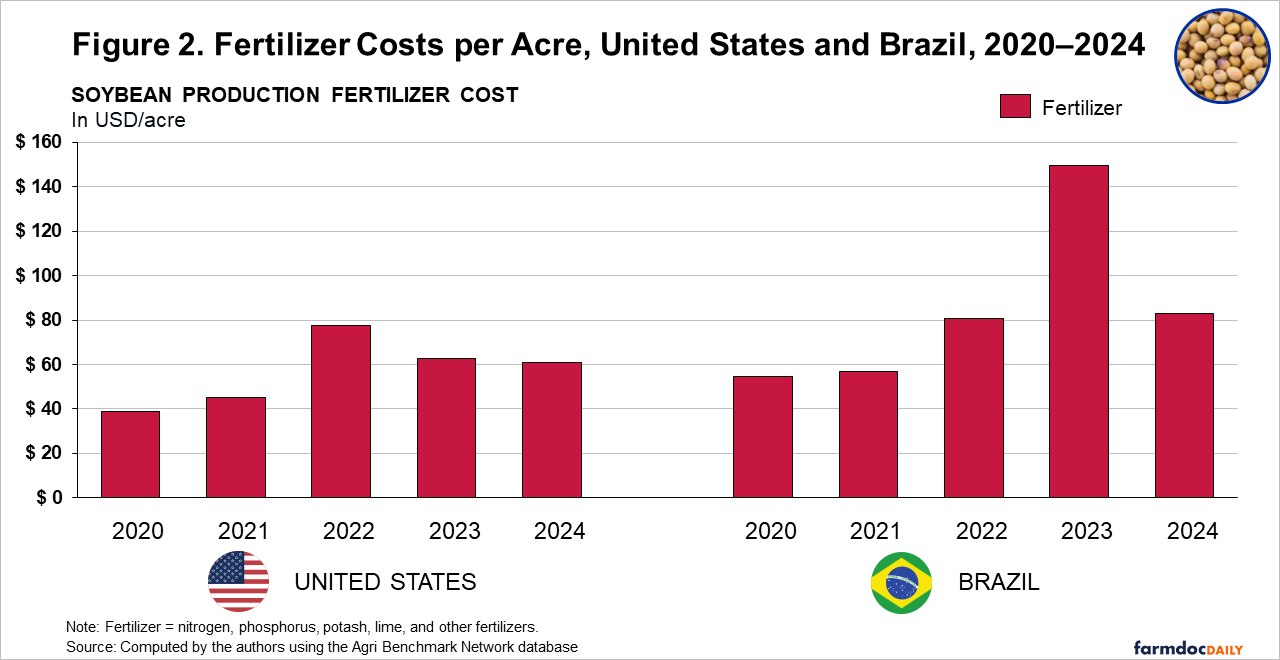
Since fertilizer is traded in dollars, Brazilian farmers pay more in local currency whenever the real weakens (Colussi and Langemeier, 2026). Russia’s invasion of Ukraine drove fertilizer prices sharply higher in 2022. U.S. fertilizer costs peaked that year at $78 per acre, double their 2020 level, while Brazilian costs peaked a year later, in 2023, at $150, nearly three times their 2020 level, as fertilizer bought at the 2022 price peak likely fed into Brazil’s 2022/23 crop. By 2024, costs had eased to $83 per acre in Brazil and $61 in the United States (see Figure 2).
Tropical Pest Pressure Raises Brazil’s Pesticide Costs
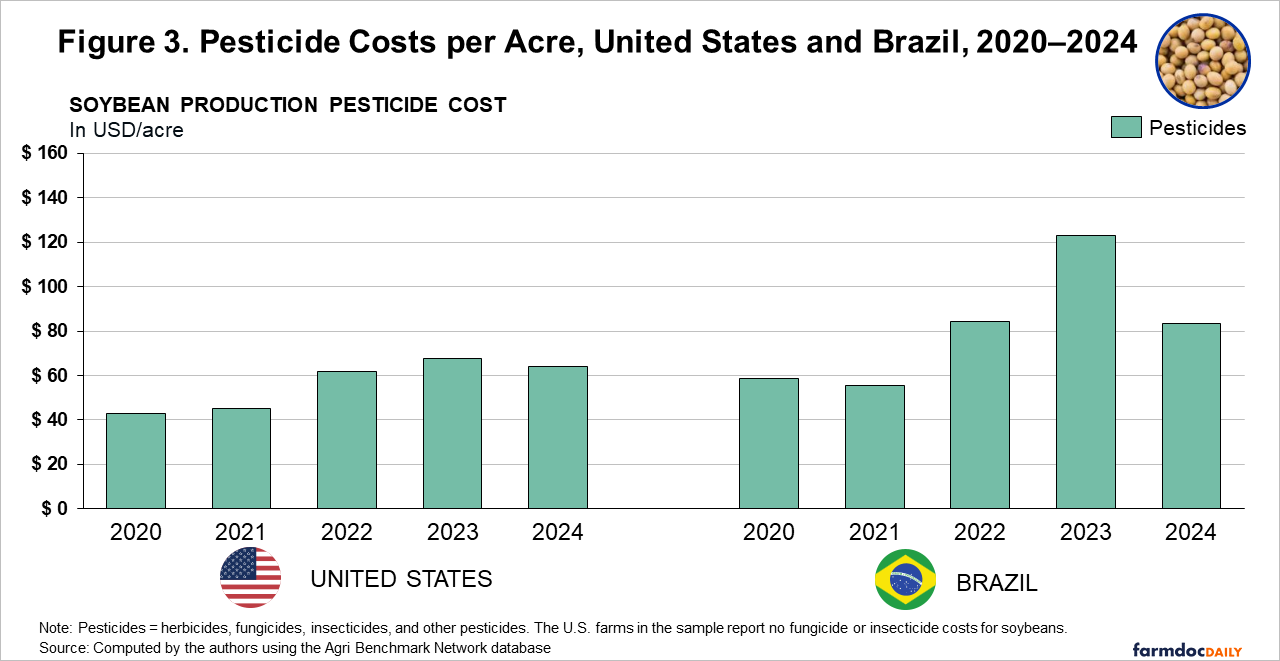
Pesticide costs followed a similar path. Brazilian farms spent more in every year analyzed, $81 versus $56 per acre on average, with costs in Brazil peaking at $123 in 2023 (see Figure 3). The mix also differs. The U.S. farms in our sample report only herbicide costs for soybeans, although nationally about one in five U.S. soybean acres receives a fungicide, and about one in five an insecticide (Valdes et al., 2026).
Note. Pesticides = herbicides, fungicides, insecticides, and other pesticides. The U.S. farms in the sample report no fungicide or insecticide costs for soybeans.
Source: Computed by the authors using the Agri Benchmark Network database
Brazilian farms also spend more on fungicides and insecticides, reflecting heavier insect and disease pressure in a climate without a hard winter freeze and with high humidity during the growing season (Colussi et al., 2023). As with fertilizer, many of these chemicals are imported and must be trucked long distances from the ports to the Center-West, where three of our four Brazilian farms are located (Valdes et al., 2026).
Higher Seed Costs in the United States
Seed is the one input on which U.S. farms spend more than Brazilian farms: $66 per acre on average versus $43 in Brazil, every year of the period (see Figure 4). Both countries plant genetically engineered seed almost exclusively, but not the same seed. The average U.S. seed carries more stacked traits, and seed prices rise with each added trait. Brazil also produces its own seed, so seed costs are less exposed to import prices quoted in dollars.
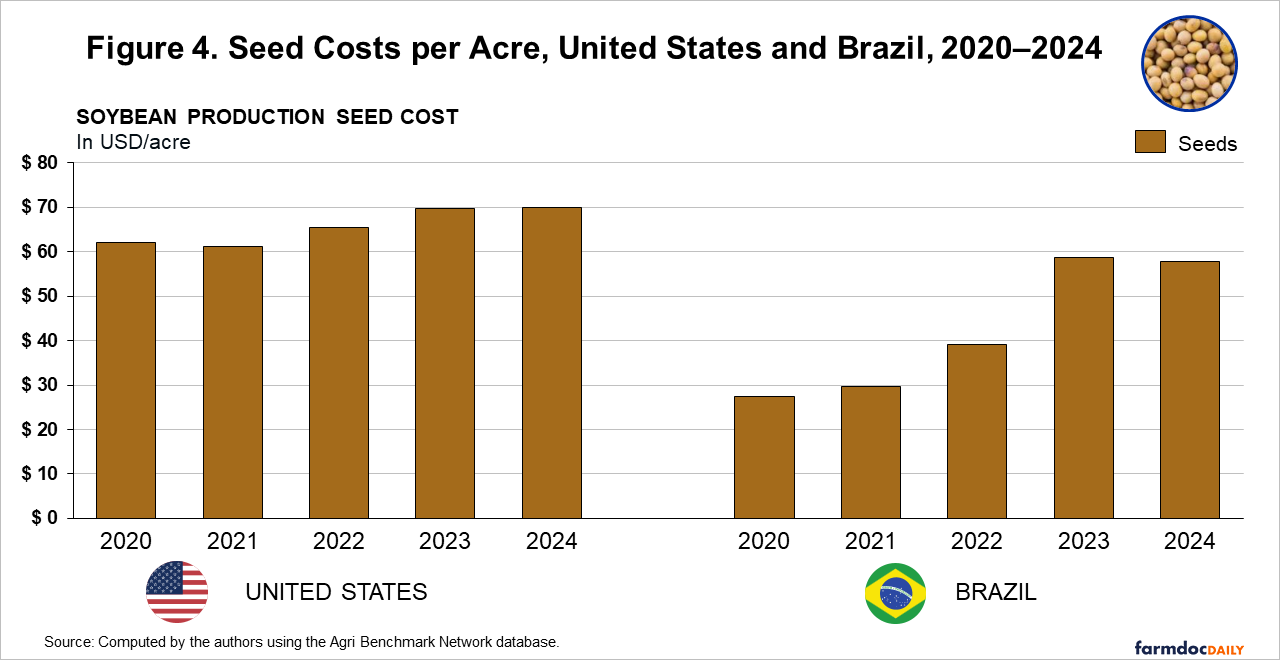
The rules on saving seeds also differ between countries. U.S. farmers cannot legally save and replant patented genetically engineered seed (Bowman v. Monsanto, 2013), while Brazilian farmers, mostly smaller ones, may save their own and pay royalties on patented traits (Valdes et al., 2026). The gap is narrowing, however: Brazilian seed costs doubled from 2020 to 2024 ($27 to $58), while U.S. costs rose 13% ($62 to $70).
Final Considerations
Among the farms in our sample, Brazil’s lower total cost does not come from inputs. Brazilian farms paid less for seed but more for fertilizer and pesticides every year analyzed, and their direct costs averaged $218 per acre, compared with $200 in the U.S. Most of the cost difference comes from overhead: $97 per acre in Brazil versus $251 in the United States.
Brazil’s reliance on imported inputs also makes its cost advantage more vulnerable to price swings. In 2023, when input costs in Brazil peaked, the gap in total cost per acre narrowed to $71. In every other year, the difference was more than $200. The message for U.S. soybean producers is twofold. Cutting input spending alone is unlikely to eliminate Brazil’s cost advantage, because most of the difference is structural, rooted in land costs. At the same time, Brazil’s advantage depends largely on lower land and imported inputs, and it erodes quickly when those prices rise.
References
Agri benchmark. http://www.agribenchmark.org/home.html. Accessed on October 13, 2026.
Bowman v. Monsanto Co., 569 U.S. 278 (2013).
Colussi, J. and M. Langemeier. "U.S. Soybean Harvest Starts with No Sign of Chinese Buying as Brazil Sets Export Record." farmdoc daily (15):173, Department of Agricultural and Consumer Economics, University of Illinois at Urbana-Champaign, September 22, 2025.
Colussi, J. and M. Langemeier. "U.S. and Brazil Soybean Competitiveness: Farm-Level Costs and Returns." farmdoc daily (16):29, Department of Agricultural and Consumer Economics, University of Illinois at Urbana-Champaign, February 23, 2026.
Colussi, J., N. Paulson, G. Schnitkey, J. Baltz and C. Zulauf. "Comparing Direct Costs of Soybean Production in the United States and Brazil." farmdoc daily (13):215, Department of Agricultural and Consumer Economics, University of Illinois at Urbana-Champaign, November 28, 2023.
Gardner, G. “Soybeans Stage a Comeback: Chinese Demand and Biofuel Growth Lead the Way.” Southern Ag Today, November 5, 2025. Available at: https://southernagtoday.org/2025/11/05/soybeans-stage-a-comeback-chinese-demand-and-biofuel-growth-lead-the-way/
Langemeier, M. "International Benchmarks for Soybean Production." farmdoc daily (14):43, Department of Agricultural and Consumer Economics, University of Illinois at Urbana-Champaign, March 1, 2024.
Langemeier, M. and J. Colussi. “Farmer Sentiment Drops as Concerns About Input Costs Increase.” Purdue Center for Commercial Agriculture, October 6, 2026. Available at: https://ag.purdue.edu/commercialag/ageconomybarometer/farmer-sentiment-drops-as-concerns-about-input-costs-increase/
U.S. Department of Agriculture. World Agricultural Supply and Demand Estimates. WASDE-676, October 9, 2026. Available at: https://www.usda.gov/oce/commodity/wasde/wasde1026.pdf
Valdes, C., J. Gillespie, D. Bonin, and S. Scott. Corn and Soybean Cost of Production in Brazil and the United States. EIB-310, U.S. Department of Agriculture, Economic Research Service, October 2026.
Disclaimer: We request all readers, electronic media and others follow our citation guidelines when re-posting articles from farmdoc daily. Guidelines are available here. The farmdoc daily website falls under University of Illinois copyright and intellectual property rights. For a detailed statement, please see the University of Illinois Copyright Information and Policies here.