


2012 Corn and Soybeans Yields Relative to Historical Yields
On August 10th, the U.S. Department of Agriculture (USDA) released its first estimates of 2012 corn and soybean yields on a state level. As one would expect given the 2012 drought, many states are projected to have poor yields. Relative to trend yields from 1972 through 2011, 2012 corn yields are projected to be the worst in four states. The lowest corn and soybean yields are located in or near the Midwest. Southern and eastern seaboard states have relatively higher yields.
Corn Yields
Figure 1 shows a map giving a percentage for each state that USDA reported a yield in its August 10th report. This percentage indicates the percent of yields from 1972 through 2011 that are below the 2012 yield. For example, Illinois’ percentage is 5%. This indicates that 5% of the yields from 1972 through 2011 are below the 2012 yield in terms of percent deviations from trend. USDA projects Illinois’ 2012 yield at 116 bushel per acre. This 116 bushel yields is -30% of the 2012 trend yield of 164 bushel per acre (-30% = 116 bushel projected yield / 164 bushel trend yield – 1). For Illinois, the 5% means that two year has larger negative deviations than 2012: 1983 with a -32% deviation and 1988 with a -41% deviation.
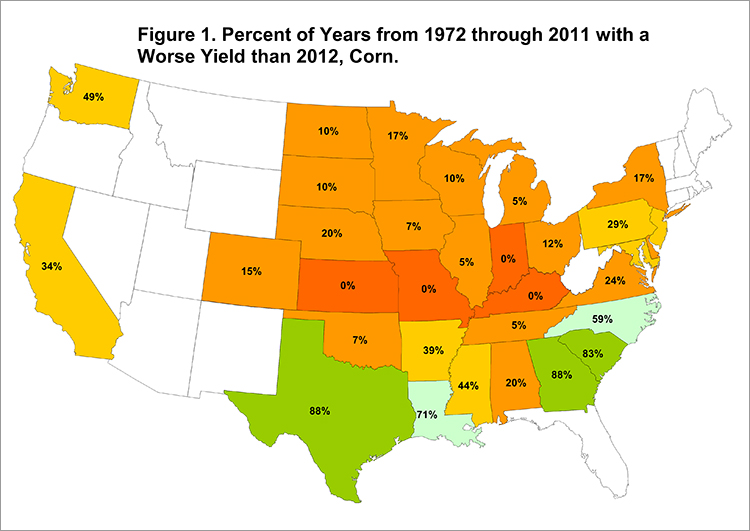
Low yields are centered in the Midwest. The 2012 state yield is the worse yield from 1972 through 2011 for four states: Indiana, Kansas, Kentucky, and Missouri. Other major corn producing states with low yields are Illinois (5%), Iowa (7%), North Dakota (10%), South Dakota (10%), Minnesota (17%), and Nebraska (20%).
States in the southern U.S. and along the eastern seaboard are projected to have relatively good yields. These states include Texas (88%), Georgia (88%), South Carolina (83%), Louisiana (71%) and Virginia (59%).
Soybean yields
Similar to corn, low soybean yields are located in the Midwest (see Figure 2). Both Indiana and Kansas only have 2% of the years with larger negative deviations than 2012. Illinois has 5% of yields below 2012 yields while Kentucky, Missouri, and Tennessee have 7% of years below 2012.

Many of the southern states have relatively high soybean yields. These states include Texas (90%), Louisiana (88%), Arkansas (63%), Alabama (69%), South Carolina (59%), Maryland (54%), North Carolina (51%), and New Jersey (51%).
Summary
Low yields are concentrated around the Midwest. Southern states and eastern seaboard states did not have a poor of a production year as the Midwest.
Disclaimer: We request all readers, electronic media and others follow our citation guidelines when re-posting articles from farmdoc daily. Guidelines are available here. The farmdoc daily website falls under University of Illinois copyright and intellectual property rights. For a detailed statement, please see the University of Illinois Copyright Information and Policies here.