Significant Reductions in Working Capital Likely in 2015 on Grain Farms
Working capital will be reduced on many Midwest farms in 2015. In this article, per acre reductions of working capital are quantified for owned, cash rented, and share rented farmland. A repeat of a year like 2015 in 2016 could see many farms back approaching a working capital situation similar to the period from 1996 to 2006, the period immediately prior to the period of higher incomes from 2006 to 2012.
Working Capital on Illinois Grain Farms
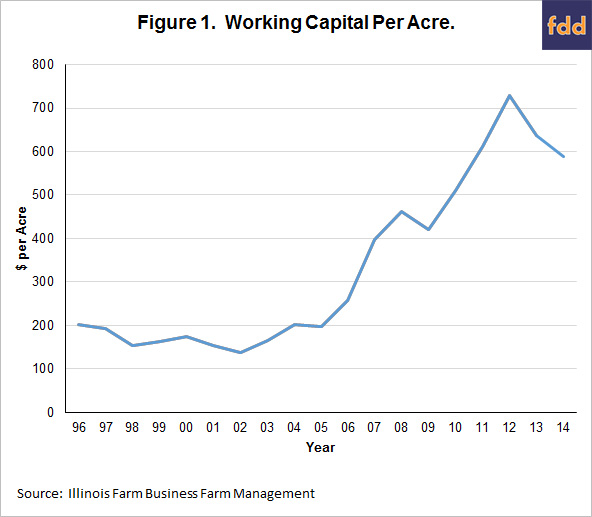
Figure 1 shows working capital per acre for Illinois farms enrolled in Illinois Farm Business Farm Management (FBFM). Working capital equals current assets minus current liabilities. Current assets include cash and cash equivalents; crop, feed, and market livestock inventories; and prepaid expenses. Current liabilities include operating loans; current portions of longer-term debt; and accrued items such as income taxes. Working capital serves as a cushion for losses that may occur. Higher levels of working capital indicate more of a financial cushion.

Working capital averaged $179 per acre from 1996 through 2006 (see Figure 1). As a result of higher incomes, working capital then increased to over $700 per acre at the end of 2012. Working capital decreased in both 2013 and 2014. At the end of 2014, working capital was $588 per acre.
Many farms still have higher financial reserves at the end of 2014 as compared to the period between 1996 and 2006. However, the total reserve does not equal to the current level minus the $179 average from 1996 to 2006. More working capital is needed now because of higher costs. Since costs have roughly doubled, working capital in the $350 to $400 per acre range now would be equivalent to the $179 per acre level from 1996 to 2006.
Take $400 per acre as the level now equivalent to the $179 per acre average during the 1996 – 2006 period. Then farmers have $188 per acre of working capital above that level from 1996 to 2006 ($188 = $588 working capital in 2014 – $400 equivalent 1996-2006 level.
The values in Figure 1 are averages. These is considerable variability in working capital across farms. Therefore, the levels represented in Figure 1 may not be indicative of a particular farm. For example, younger farmers tend to have less working capital than older farmers. Also, farms that cash rent more of their farmland typically have lower levels of working capital.
Working Capital Change for 2015
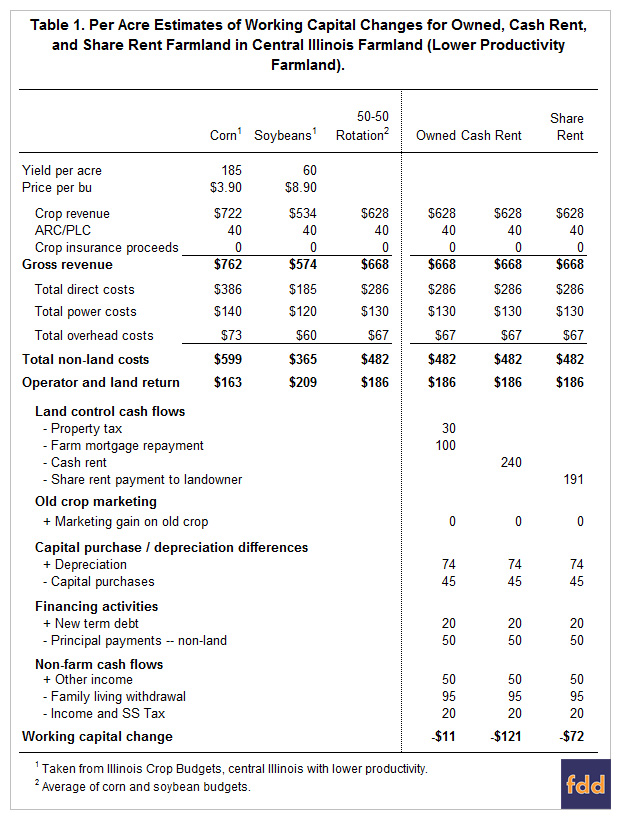
Table 1 shows a process for estimating working capital changes for 2015. Values used in this table are meant to represent the typical case. This process begins with corn and soybean budgets. In Table 1, budgets are adapted from 2015 Illinois Crop Budgets here for low-productivity farmland in central Illinois. Yields per acre are 185 bushels per acre for corn and 60 bushels per acre for soybeans. Prices used in budgets are $3.90 per bushel for corn and $8.90 per bushel for soybeans. Corn has an operator and land return of $163 per acre. Soybeans have a $209 per acre operator and land return. A 50% corn and 50% soybean rotation results in $186 per acre of operator and land return (see the third column of Table 1).

Working capital changes are estimated for owned, cash rented and share rented farmland, as shown in the final three columns of Table 1. In calculating working capital changes, all land control methods begin with the $186 per acre operator and land return, the same as for the 50-50 rotation. From these operator and land returns, five general areas of cash flow adjustments are made to arrive at working capital changes:
- Land control cash flows: For owned farmland, cash flows are property taxes and farm mortgage repayments (including principal and interest). In Table 1, land control cash flows are $30 per acre for property tax and $100 for farm mortgage repayments. For cash rent farmland, land control costs are cash rent, set at $240 per acre roughly equal to the average for this land productivity. Share rent costs are $191 per acre, equaling the land owner’s share of gross revenue and direct costs. In Table 1, a 50-50 share rent agreement is used.
- Old crop marketing: Old crop marketing represents the difference in the sales price of the old crop from the value of the old crop placed on the end-of-year 2014 balance sheet. No marketing losses are included, although some farms could have significant losses.
- Capital purchase/depreciation differences. If capital purchases are less than depreciation, then working capital will not decrease as much as indicated by depreciation. In the 2015 budgets, depreciation for machinery and building is at $74 per acre (see Table 1). Capital purchases are set at $45 per acre, roughly the level of purchases between 2000 through 2004.
- Financing activities: These cash flows include acquiring debt and principal payments on non-land items. Farm mortgage principal is contained in land control cash flows. New debt of $20 per acre represents financing on new machinery purchases is used in calculations. Principal payments are $50 per acre.
- Non-farm cash flows: Other income includes off-farm jobs and returns on non-farm investments. Family living is set at $95 per acre, down from the average in recent years. Income and social security taxes are at $20 per acre.
Given these estimates, working capital change is projected at -$11 per acre for owned farmland, meaning that working capital would decrease $11 for each acre owned. Cash rent has a -$121 per acre working capital change and share rent has a -$72 change.
Commentary
The above estimates are close to an “average” farm; however, the above estimates will vary from farm-to-farm. Debt position, off-farm activities, and capital purchases will all impact working capital changes. Also having an impact on working capital will be the level of cash rent. Cash rents will vary from farm-to-farm by as much as $100 per acre. As a result, individual farms should estimate working capital changes on their individual farms.
A typical distribution of land control in central Illinois is 19% owned, 39% cash rented, and 42% share rented. Given the estimates in Table 1, a farm with this distribution would have -$79 per acre average working capital change (-$79 = $11 owned land x .10 + -$121 cash rented land x .39 + -$72 share rented land x .42). Given that this farm also has the average working capital of $588 per acre at the end of 2014, this farm would have $509 or working capital at the end of 2015. At the end of 2015, this farm would still have working capital above the $400 equivalent level to the 1996-2006 period. However, it is eroded close to half. One more year like 2015 would result in this farm being back slightly above 1996 to 2006 reserve levels.
Obviously, land tenure differences will impact working capital changes. Farms with more owned farmland likely would have less negative, and maybe even positive, changes in working capital. Farms with a high proportion of cash rent farmland will have much larger working capital losses. Farms with a high proportion of cash rent farmland at high cash rent levels will be the farms with the largest working capital erosions.
Summary
In 2015, reductions in working capital will occur on many grain farms in Illinois. Farms with typical percentages in owned, cash rent, and share rent categories likely will see significant working capital reductions. If 2016 prices, yields, and costs are similar to 2015 prices, yields, and costs, the average farm will see their working capital levels back to the equivalent of the 1996 to 2006 period.
Of course, farms will vary from values in Table 1 depending on many factors. Farms with lower debt payments and higher off-farm income will have more working capital. Farms with more cash rent farmland will have more negative working capital changes than farms with less cash rented farmland.
Yields and prices in Table 1 could change. Higher prices, higher yields, or a combination of higher prices and higher yields could result in more income. Many farms are reporting higher than expected soybean yields. Increases in commodity prices would be beneficial as well. Yields and prices will come into clearer focus as the year progresses.
Disclaimer: We request all readers, electronic media and others follow our citation guidelines when re-posting articles from farmdoc daily. Guidelines are available here. The farmdoc daily website falls under University of Illinois copyright and intellectual property rights. For a detailed statement, please see the University of Illinois Copyright Information and Policies here.


