


2013 Projected Soybean Yields Compared to Trend Yields
On September 12th, the USDA released revised projections of 2013 state soybeans yields. Also released were 2013 projected crop reporting district (CRD) yields for Illinois, Indiana, Iowa, Kansas, and Missouri. These projected yields are compared to 2013 trend yields to assess which areas of the country are having better relative yields than other areas. A similar post on Friday evaluated corn yields (click here for that post).
State Projections
Figure 1 shows projected state yields divided by trend yields, hereafter referred to as relative yields. Illinois’ relative yield is .96. This means that the USDA’s projected yield for 2013 of 46 bushels per acre is .96 of the 48 bushel trend yield (i.e. .96 = 46 yield in 2013 / 48 trend yield). The 2013 trend yields were calculated by fitting a trend line through state level yield data from 1975 through 2012, and then projecting 2013 yields. Relative yields above 1.0 indicate that yields are above trend. Relative yields below 1.0 indicate that the projected yield is below trend. Overall, higher values indicate better yields relative to expectations.
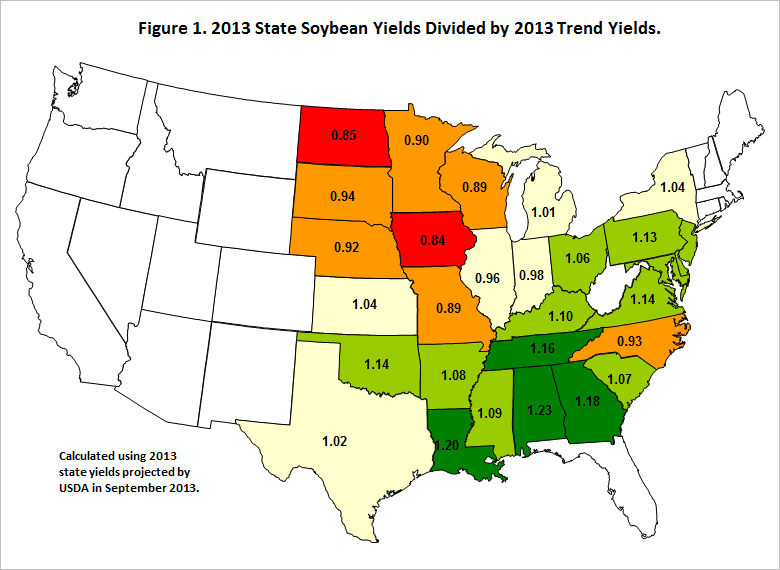
The highest relative yields occur in the southern United States. Alabama has a relative yield of 1.23, Louisiana has a 1.20 relative yield and Georgia has a 1.18 relative yield. From these highs, relative yields decrease towards the western corn-belt and upper Midwest. A block for states from North Dakota down to Nebraska, over to Iowa, up to Wisconsin and back to North Dakota have projected relative yields below .95. States with the lowest relative yields are Iowa at .84 and North Dakota at .85.
CRD Projections
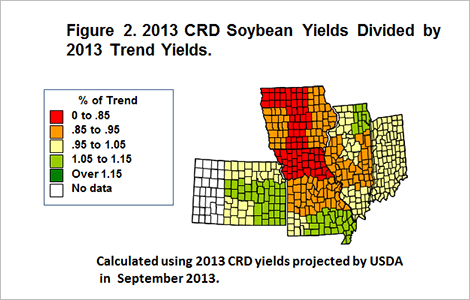
A more refined view of relative yields can be gained for the five states for which CRD yields were released by USDA (see Figure 2). The lowest relative yields occur in northwest Iowa, central Iowa, and northern Missouri. These areas had relative yields below .85. Areas with 1.05 yields or higher include eastern and central Kansas, southern Missouri, and northeast Illinois. Indiana, parts of central Illinois, northwest Illinois, southern Missouri, and eastern and central Kansas have relative yields close to 1.0.
Summary
Within the corn-belt, the eastern corn-belt is having higher yields relative to trend than the western corn-belt. The worst relative yields are in Iowa and Missouri.
Disclaimer: We request all readers, electronic media and others follow our citation guidelines when re-posting articles from farmdoc daily. Guidelines are available here. The farmdoc daily website falls under University of Illinois copyright and intellectual property rights. For a detailed statement, please see the University of Illinois Copyright Information and Policies here.