


Break-Even Corn Prices: History and Projections
For farmland that is cash rented near average rent levels, break-even corn prices have increased from $1.67 per bushel in 2004 to the mid-$4.00 range in 2013 and 2014. Mid-$4.00 break-even prices will cause losses when corn prices are in the in the low-$4 range or below. There are good possibilities of prices being below break-even prices over the next several years.
Calculation of Break-Even Prices
Break-even prices were calculated using summary data from Illinois Farm Business Farm Management (FBFM) as reported in “Revenue and Costs for Corn, Soybeans, Wheat, and Double-Crop Soybeans” (available here). Break-even prices are reported for northern, central, and southern Illinois, with the central region divided into categories for high-productivity and low-productivity farmland.
Break-even prices were calculated by adding per acre non-land costs and cash rent together, and then subtracting government payments and crop insurance proceeds. This per acre break-even value gives the amount of crop revenue necessary to break-even. For northern Illinois in 2014, non-land costs are projected at $565 per acre, average cash rent at $264 per acre, and there are no government payments or crop insurance proceeds projected for 2014. This gives $829 of crop revenue ($565 non-land costs + $264 cash rent) that must be obtained to break-even in 2014. Given a 187 bushel per acre expected yield, the break-even price is $4.43 per bushel ($829 crop revenue / 187 bushel yield).
Inclusion of government payments and crop insurance proceeds lowers break-even prices. In recent years, government program payments only include direct payments, which average $21 per acre in northern Illinois. A direct payment is not projected for 2014. Similarly, break-even prices are lowered by crop insurance proceeds. In particular, break-even prices in the drought year of 2012 would have been much higher had crop insurance proceeds not been included in break-even calculations.
Break-even prices are calculated given a cash rent situation with cash rent levels near averages. Farms with above average cash rent levels will have higher break-even levels, and vice versa. Break-even prices will differ for owned and share rent farmland.
Break-Even Prices
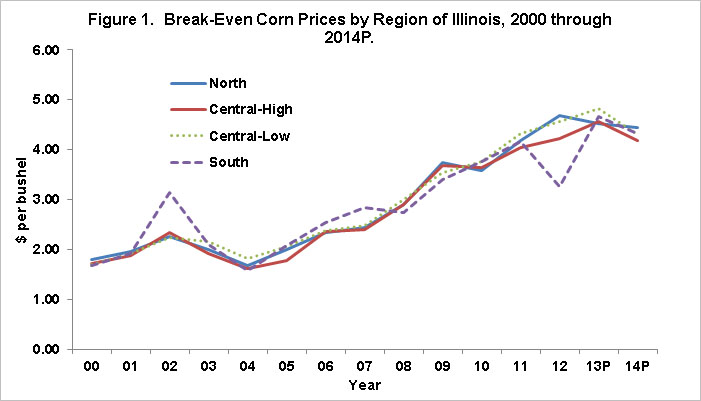
Over time, break-even prices in the northern, central-high (high productivity farmland), central-low (low productivity farmland) and southern regions have tracked each other closely (see Figure 1). While yields vary across the regions, offsetting differences in cash rents tend to even out break-even prices across the regions. One notable exception in similar break-even prices occurred in 2012, when southern Illinois had a much lower break-even price than the other regions. Southern Illinois’ 2012 break-even price was lower because of higher crop insurance payments than other regions. Because regional break-even prices track each other closely in most years, the averages of break-even price across regions are reported in the remainder of this post.
In 2004, break-even prices averaged $1.67 per bushel. Between 2004 and 2013, break-even prices increased each year: $1.98 in 2005, $2.40 in 2006, $2.54 in 2007, $2.88 in 2008, $3.59 in 2009, 3.69 in 2010, $4.18 in 2012, $4.19 in 2012, and $4.65 in 2013. Increases in both non-land costs and cash rents led to the increases in break-even prices.
The projected 2014 break-even of $4.31 per bushel is projected below 2013 levels. Two items lead to lower 2014 break-even levels. The first is lower fertilizer prices. In northern Illinois, fertilize costs per acre are projected at $140 per acre, down from 2013 projected levels of $170 per acre. Second, 2014 yields are projected higher than 2013 levels.
Summary and Commentary
Currently, cash grain bids for 2013 fall delivery are $4.40 per bushel, below the projected 2013 break-even level of $4.65 per bushel. Cash bids for 2014 fall delivery are near $4.35 per bushel, near the $4.31 per bushel break-even level. Corn prices in the low $4.00 and high $3.00 per bushel range are possible over the next several years, leading to the possibility of losses.
There are some possibilities that break-even prices may decline over time. Non-land cost could decrease; however, this process will be slow and there are limits to likely non-land cost decreases. Further decreases in break-even prices are possible with cash rent decreases. However, cash rents tend to be “sticky”. This suggests a protracted period of losses would have to occur before cash rents decline.
Disclaimer: We request all readers, electronic media and others follow our citation guidelines when re-posting articles from farmdoc daily. Guidelines are available here. The farmdoc daily website falls under University of Illinois copyright and intellectual property rights. For a detailed statement, please see the University of Illinois Copyright Information and Policies here.