


Estimated GRIP Payments for 2013
Insurance payments for 2013 Group Risk Income Plans (GRIP) policies will not be known until the National Agricultural Statistical Service (NASS) releases county yields in late February, 2014. Herein, GRIP payments are estimated for 2013 based on released Crop Reporting District (CRD) yields. As a result of price decline, GRIP will make payments for corn in many Illinois counties. GRIP is not likely to make payments for soybeans in Illinois.
Estimation Methodology
For each CRD, the 2013 CRD yield is stated as a percent of that CRDs trend yield. For example, the Northwest Illinois CRD has a 2013 corn yield of 184 bushels per acre and trend yield of 176 bushel per acre, giving a 2013 yield as a percent of trend of 1.05 (184 bushels / 176 bushels).
All CRDs had 2013 corn yields as a percent of trend above one: Northeast at 1.10, West at 1.06, Central at 1.06, East at 1.06, Southwest at 1.11, Southeast at 1.17, West Southwest at 1.19, and East Southeast at 1.12. Corn yields above trend indicate that corn yields likely will be above expected yields used by the Risk Management Agency (RMA) in setting GRIP guarantees. It also suggests a relatively good corn production year in Illinois.
Soybean yields as a percent of trend are all close to 1: Northwest at 1.00, Northeast at 1.10, West at .94, Central at 1.02, East at .96, Southwest at 1.06, Southeast at 1.02, West Southwest at .96, and East Southeast at 1.03. These percentages suggest that county yields will be near expected yields using by RMA in setting GRIP guarantees.
For each county, the county yield is estimated by taking the expected yield used by the RMA in calculating GRIP guarantees and multiplying it by the respective CRDs 2013 yield as a percent of trend yield. These projected county yields then are used in estimating GRIP payments.
2013 GRIP Payments for Corn in Illinois
The 2013 projected price for corn is $5.65 per bushel and the harvest price is $4.39 per bushel. Because the harvest price is below the projected price, GRIP policies with and without the harvest revenue option will make the same payments. The harvest price is 76% of the projected price. Because of the relatively large price decline, GRIP will make payments even though county yields likely will be above RMA’s expected yields in many counties.
Figure 1 shows estimated GRIP payments for corn across Illinois counties for a 90% coverage level and a 100% protection level. The 100% protection level is the highest possible protection level and results in the largest payments. Many farmers using GRIP could have chosen a lower protection level, resulting in lower estimated payments than those shown in Figure 1. For example, Champaign County’s estimated payment is $126 per acre at a 100% protection level. At the lowest protection level of 60%, Champaign County’s payment equals $76 per acre ($126 x .6).
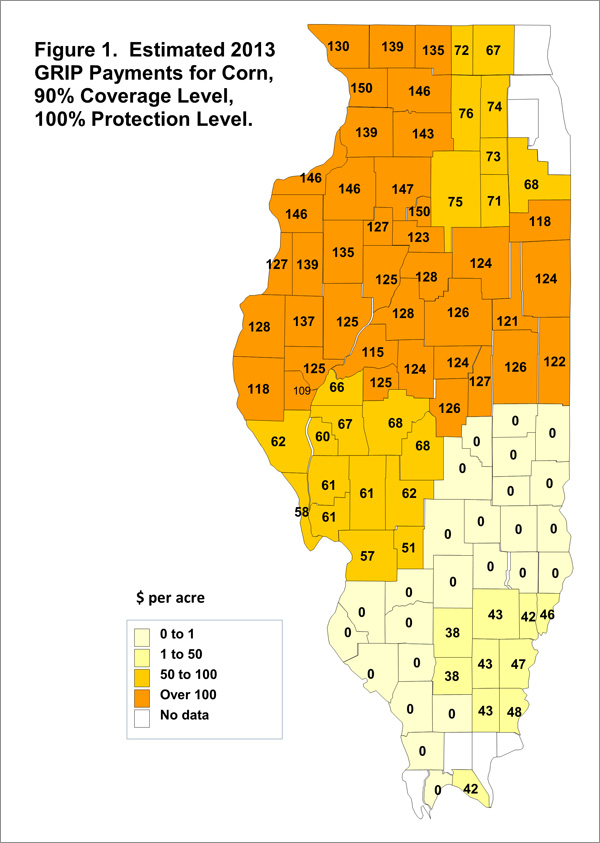
Many counties in northern and central Illinois are expected to have payments that exceed $100 per acre. Given the estimation procedures, counties in the southeast and west southwest CRDs are not projected to have payments. These two CRDs are have yields projected to be 17% and 19% higher than trend yields, offsetting the revenue losses resulting from price declines.
2013 GRIP Payments for Soybeans in Illinois
For soybeans, the 2013 projected and harvest prices both equal $12.87 per bushel. Because the projected and harvest prices are the same, yields would have to fall at least 10% before GRIP will make payments. All CRDs have 2013 yields above 94% of trend yields, suggesting no GRIP payments for soybeans.
Summary
GRIP will make payments for corn in many Illinois counties. This occurs because the harvest price is below the projected price. Payments are not likely for soybeans. Actual payments will vary from those shown here because county yields will vary from projected county yields.
The projected GRIP payments for corn illustrate a strength of GRIP. Because of its 90% coverage level, GRIP provides better protection against lower prices than does the COMBO product where the highest coverage level is 85%. GRIP payments for corn in 2013 will offset some of the much lower corn revenues occurring in 2013.
Disclaimer: We request all readers, electronic media and others follow our citation guidelines when re-posting articles from farmdoc daily. Guidelines are available here. The farmdoc daily website falls under University of Illinois copyright and intellectual property rights. For a detailed statement, please see the University of Illinois Copyright Information and Policies here.