


U.S. Farm Input Price Dynamics, 1981-2013
Background
The sharp drop in crop prices over the last 2 years has focused attention on farm input prices. In particular, how closely do farm input prices follow crop prices? To put this question in historical perspective, this article looks at various aspects of the dynamics of U.S. farm input prices since 1981. Findings include that, after adjusting for general price inflation, not all farm input prices have increased, that farm input prices do adjust with crop prices, that the adjustment varies by input but is a lag process that becomes larger over time, and that, on average across the inputs examined in this article, the adjustment process appears to reach closure after approximately 5 years.
Data and Analysis
The prices used in this study are price indexes for all crop prices received by farmers and 6 categories of inputs – ag services and rents, chemicals, fertilizer, fuels, machinery, and seed. The data for ag services and rents does not begin until 1971. We want to examine changes up to 10 years in length. Hence, our analysis cannot begin until 1981 due to the need for a 10 year window. It would be nice to have rent as a separate category, but such data does not begin until 1990. Since 1990, the price indexes for rent and ag services plus rent have a high but not perfect correlation and thus findings are similar but not the same for both input categories. The data ends with 2013, the last year with complete information. Source for the price data is the U.S. Department of Agriculture (USDA), National Agricultural Statistics Service (NASS) Quick Stats website.
Because general price inflation is likely to differentially impact the various price indexes and was a factor over the analysis period, we deflate all price indexes by the Gross Domestic Product (GDP) implicit price deflator. The GDP deflator is generally considered the best measure of general price inflation in a country’s economy. Source for this deflator is the Economic Report of the President.
The association between the general inflation-adjusted or real changes in crop price and input price is calculated for periods of 1 to 10 years to assess immediate, short term, and longer term relationships. Price change is calculated as the real price index at the end of the period divided by the real price index at the beginning of the period. One is then subtracted from this ratio to generate the percent change in price from the beginning to end of the period. Two measures of association are examined: slope and R2 of the regression equation between percent change in real price of an input category relative to percent change in real crop price over the same period. In this regression, both the slope and R2 are percent changes. The slope measures the percent change in real input price associated with a 1% change in real crop price. R2 can vary from 0% to 100%, with 0% implying no relationship between the two price indexes and 100% implying a perfect relationship. The higher is the slope or R2, the higher is the association.
Price Trends since 1981
To provide a broad perspective, average annual change in real price is calculated over the 1981-2013 period (Figure 1). This period begins at the end of the 1970 period of farm prosperity. Between 1981 and 2013, the real price index of all U.S. crops declined -0.3%/year. Also declining was the real price of chemicals (-0.3%/year) and ag services and rent (-0.2%/year). Real price of seed increased the most (+3.1%/year), which was not unexpected. Real price of fuels and machinery both increased +2.0%/year while real fertilizer price increased +1.0%/year. The diversity in long-term real price trends across farm inputs is the key message of Figure 1.

Association between Crop and Input Price Change
A key message from Figure 2 is again the variation across inputs, this time in the R2 association between the change in real input price and the change in real crop price. In most years, fertilizer has the highest R2 association with changes in the real price of crops. It is the only input with an R2 association greater than 50% for any number of years, reaching a high of 80% at 10 years. Seed has the lowest R2 association. It never exceeds 13% (5 and 7 years). R2 association for chemicals is also relatively low, never exceeding 32% (7 and 9 years). In general, a relatively low level of R2 association exists, leading to another key message from Figure 2 that factors other than the change in real crop prices are important determinants of the change in the real price of farm inputs.

Substantial variation across inputs is again a message from Figure 3. It presents the second measure of association: the regression slope or the percent change in real input price associated with a 1% change in real crop price. This figure can be divided into a group of inputs whose price is responsive to changes in the price of crops and a group of inputs whose price is not very responsive. Percent change in the real price of fertilizer, fuels, and seed approaches or exceeds 1% for every 1% change in the real price of crops, especially at periods of 5 or more years. In contrast, percent change in the real price of chemicals, machinery, and ag services and rent never exceeds 0.4% for every 1% change in the real price of crops. As with Figure 2, fertilizer has the highest association. Chemicals is again on the low end. Rank order of the other inputs varies between Figures 2 and 3.

Association over Time
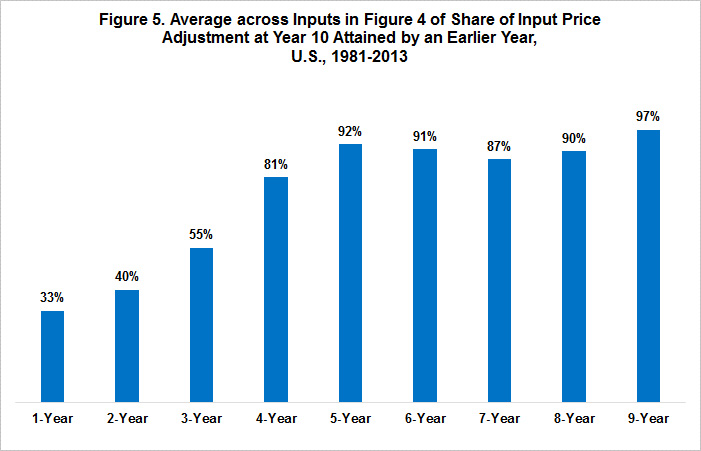
Both Figures 2 and 3 reveal an association that increases as the period of time lengthens. Figures 4 and 5 help draw out this observation. Figure 4 presents the slope coefficient for a length of time relative to the slope coefficient for year 10. In essence, Figure 4 depicts the percent of adjustment at year 10 that is achieved as of a shorter period of time. Figure 5 presents the average value of the slope ratios for all 6 inputs by time period. One reason for benchmarking the slope coefficients to their year 10 value is that there is no reason to believe that all inputs should have the same adjustment path to a 1% change in the real price of crops. This observation is consistent with the variation across inputs observed in Figures 2 and 3. A factor that helps explain some of the variation is the commonly-accepted argument that productivity increases have varied by input. The higher the increase in the productivity of an input, the higher the price farmers can pay for the input, given all other factors. Despite the observed variation in adjustment paths across the 6 inputs, it appears that the input price adjustment path is mostly completed by year 5. Moreover, Figure 5 suggests that, across all inputs, it appears that in general about one third of the adjustment occurs in year 1, with the remaining adjustment occurring throughout the next 4 years.

Summary Observations
- The assessment presented in this paper is a simple assessment. Many potential explanatory factors have not been examined. Nevertheless, simple assessments can be useful in drawing the box that surrounds an issue, in this case what is the adjustment of input prices in response to a change in crop prices. Based on this simple assessment, the following findings and implications are suggested.
- Input prices do adjust to crop prices.
- This finding implies that a natural profit hedge exists in farming in which input prices adjust with crop prices to maintain a profit level.
- The degree of adjustment of input prices to crop prices varies across inputs. Price of fertilizer appears to have the strongest association with changes in crop prices while the price of chemicals appears to have the weakest association with change in crop prices.
- These two findings imply the natural profit hedge associated with adjustment in input prices varies across crops, being strongest for crops with fertilizer as the highest share of input costs. Using the 2013 cost of production data from USDA, the highest ratio of fertilizer cost to total cost is corn at 23%. Sorghum and wheat are second, at 15%. The lowest ratio of fertilizer cost to total cost is soybeans at 8%. Thus, based on this simple relationship, corn appears to have the strongest natural profit hedge in terms of input price adjustment.
- Most of the adjustment in input prices examined in this study appears to be completed by year 5.
- This observation implies farms need a 5 year plan to bridge the gap between major changes in crop prices and the resultant adjustment in input prices. This observation applies to price increases and decreases. Expansions that extend beyond 5 years are subject to increasing risk from rising input prices while a 5-year survival strategy is needed for crop price declines.
- Farm programs and crop insurance can help bridge the 5-year adjustment path, but their bridge should be temporary, not permanent. Input suppliers become a non-trivial beneficiary if government support is long term as they can avoid adjusting input prices downward. This observation may be one reason that, since World War II, all major declines in crop prices that persisted over multiple years led to downward adjustments in price support levels. Such downward adjustments occurred during the 1950s and 1960s in response to the continuing surpluses after World War II and in the 1985 farm bill as a reaction to the high price supports exiting the 1970s. It will be interesting to see if the same situation emerges with regard to the higher reference prices enacted in the 2014 farm bill.
This publication is also available at http://aede.osu.edu/publications.
Disclaimer: We request all readers, electronic media and others follow our citation guidelines when re-posting articles from farmdoc daily. Guidelines are available here. The farmdoc daily website falls under University of Illinois copyright and intellectual property rights. For a detailed statement, please see the University of Illinois Copyright Information and Policies here.