


Important Trends in Crop Insurance Coverage Options for 2012
The Risk Management Agency (RMA) recently announced the approval of the Trend Adjusted APH Yield Endorsement for corn and soybean insurance policies for most counties in the major crop production regions beginning with the 2012 crop (here). The Endorsement was originally proposed by the Illinois Corn Marketing Board, and developed in conjunction with researchers at the University of Illinois and the integrated Financial Analytics and Research (iFAR) consulting group. It is available for all APH-based yield and revenue options in the Combo policy and is elected and applied on a county/crop basis. The endorsement will be available over 820 counties for corn and over 880 counties for soybean policies. A map of the coverage is available at: here. The intent of the Policy Endorsement is to improve the accuracy of the estimate of future insured yields, and to allow accurate coverage elections to be made against expected crop production.
The Issue
In simplest form, a producer’s APH is a simple average of at least four and up to ten actual historic yields. The APH then serves as an estimate of future yields and the producer elects a fractional coverage of the expected yield to indemnify either expected yields or expected revenue.
However, yields have increased systematically through time, and the average of the past does not generally result in an accurate estimate of the future. Figure 1 below shows the yields through time for corn in Illinois along with a yield trend line (solid black line) showing the average rate of increase through time. Just as the CPI can be used to adjust historical prices to their current equivalent values, the information in the yield trend can be used to adjust historic yields to their current equivalent levels.

The Approach
Historic NASS yield data series for each county/crop combination were examined, along with weather impacts, using a spatially smoothed estimator to identify yield trends in each location for both corn and soybeans. To be eligible to use the Trend Endorsement, certain producer data requirements are considered including the need to have at least one actual yield record in the previous 4 years, and limited use of transitional or substituted yields. Additionally, if the producer’s APH database has less than 4 actual yields in the previous 12 years, the adjustment is prorated (more complete eligibility and calculation procedures are available at the RMA website).
The other data eligibility screens can be interpreted as generally sensible requirements to encourage quality of data, and to remove some perceived incentives to “lose” older data due to its loss of representativeness through time, while encouraging accurate and complete future reporting.
The basic approach of the Endorsement is to adjust each actual yield used in the calculation of the APH for the amount of time that has passed since its observation to better reflect the yield it would represent in the insured period. An example is provided below to help clarify.
The Impacts
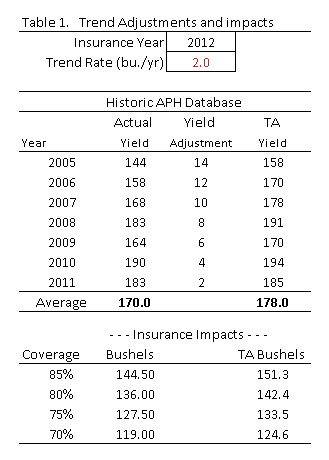
In this example, the producer is in a county with a 2.0 bushel per year trend rate (actual yield trends vary by location) and has 7 records in the associated APH database with a current APH average of 170 bu./acre. If all eligibility requirements are met, the effect of the endorsement is to add 2 bushels to the yield from 2011, 4 bushels to the yield from 2010, and so on to each of the records used in the calculation of the average. The Trend Adjusted APH is then calculated as the average of the adjusted yields, in this case resulting in an eight bushel increase to 178 bu./acre. The insurance impacts are shown in the lower section of the table. Under this endorsement, a coverage election of 80% results in an increase in bushels covered from 136 to 142.4 or a 6.24 increase in effective bushels covered. An alternative way to think about the effect is that to get 144.5 bushels of coverage under the original APH, the producer would have to buy 85% coverage. Under the trend adjusted coverage, the producer would have to buy the equivalent of 81% coverage to achieve the same degree of protection.
Premium impacts will depend somewhat on the projected price and volatility factors that occur next Spring, and on final base rates that are being determined by RMA, but importantly, base rates per bushel will not be affected by the trend endorsement.
The farmdoc crop insurance section contains premium calculators, payment evaluators, and other tools to help farmers evaluate their crop insurance alternatives. A tool will be released prior to sign up period with final trends and a simple estimator to identify the effect of the trend adjustment for producers in their own operations.
We view the availability of this endorsement as another important step in RMA’s ongoing efforts to offer effective and equitable risk management products for producers. Additionally, crop insurance seems to be increasingly viewed as one the best and most viable farm bill policy options for providing a meaningful and reliable “safety net” for producers. We hope these trends continue as well.
Disclaimer: We request all readers, electronic media and others follow our citation guidelines when re-posting articles from farmdoc daily. Guidelines are available here. The farmdoc daily website falls under University of Illinois copyright and intellectual property rights. For a detailed statement, please see the University of Illinois Copyright Information and Policies here.