


Persistence in Management Returns for Illinois Grain Farms, 2005-2009
In this post we take a look at the persistence of farm performance as measured by management returns for Illinois grain farms from 2005 to 2009 using data from the Illinois Farm Business Farm Management (FBFM) association. Management returns include gross revenues, direct inputs, power and equipment, building, labor, land, and other miscellaneous costs. Tax costs are not included with the exception of farmland property taxes. A total of 712 Illinois grain farms were included in the analysis. A grain farm was defined to be an operation with more than 90% of total acreage planted to corn and soybeans and less than 40% of the grain produced fed directly to livestock. Additionally, farms generating more than 10% of their total gross revenue through custom farming or livestock enterprises were not included.
Farm performance was classified by categorizing farms which earned management returns in the top quartile (25%) of all farms in each year. Only 3.2% of the farms were classified in the top quartile for each of the 5 years analyzed, illustrating how difficult it might be for farms to outperform their peers consistently over time. Approximately 2/3 of the farms were in the top quartile in at least 1 of the 5 years. In the discussion that follows, farms will be classified into three distinct groups: 1) consistent performers include farms which were in the top quartile for all 5 years (“Consistent Top”), 2) farms which were in the top quartile for 1 to 4 years (“All Others”), and 3) farms which never fell in the top performance quartile (“Never Top”). Averages are compared across the three groups to analyze factors which may contribute to or characterize the difference between operations with consistently high management returns.
Figure 1 illustrates the differences in management returns earned by the three farm groups over time. The gap between average management returns between consistent performers and farms never in the top quartile ranges from about $140 in 2005 and 2006, to over $220 in 2008. These significant differences in management returns can be due to differences in revenues, costs, or a combination of both. The analyses which follow quantify the contributions of revenue and cost differences to this gap in overall management returns across performance groups.
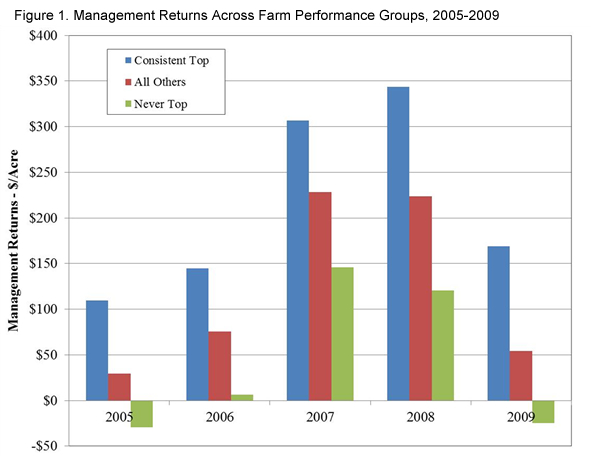
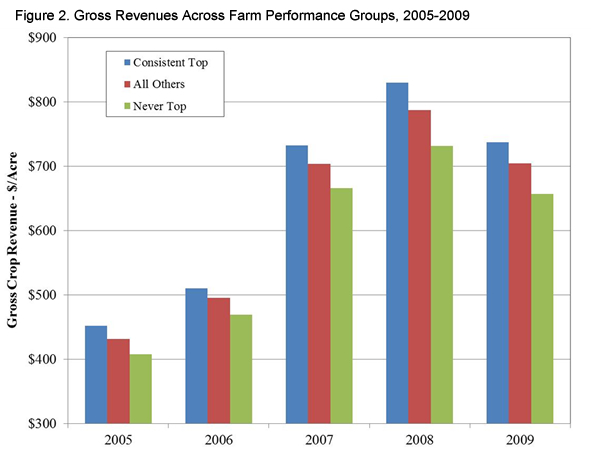
Figure 2 reports the average gross revenue for each farm group over time. The gap in average revenues across the farm groups ranges from $40 to a high of $98 in 2008. The higher revenues earned by consistent top performers accounts for anywhere from 30% to 70% of the difference in average management returns.
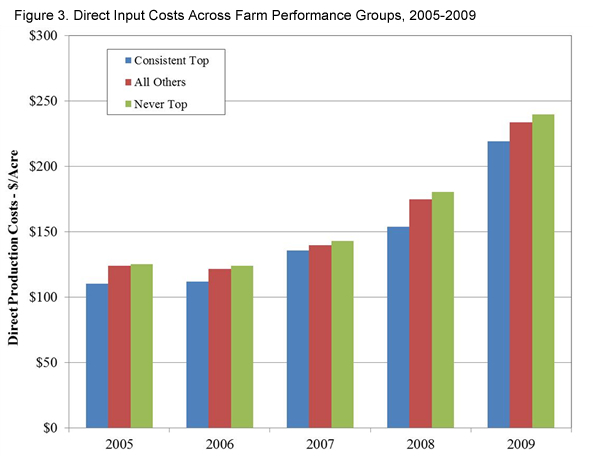
Figures 3 and 4 report information on two cost categories: direct inputs such seed and fertilizers, and power costs primarily related to farm machinery. A difference in the average costs of the performance groups in both of these categories is apparent. Direct input costs differ by $10 to $20 per acre on average, representing 5% to 18% of the difference in management returns across groups. Average power costs differ by $25 to $35 with this difference increasing over the time period examined. This difference in average power costs represents 20% to 27% of the difference in average management returns between performance groups.

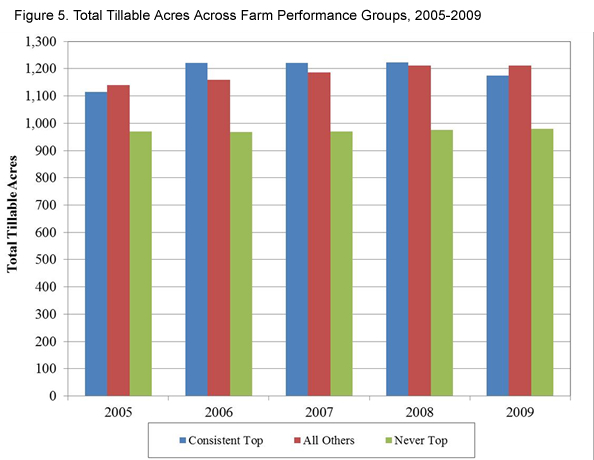
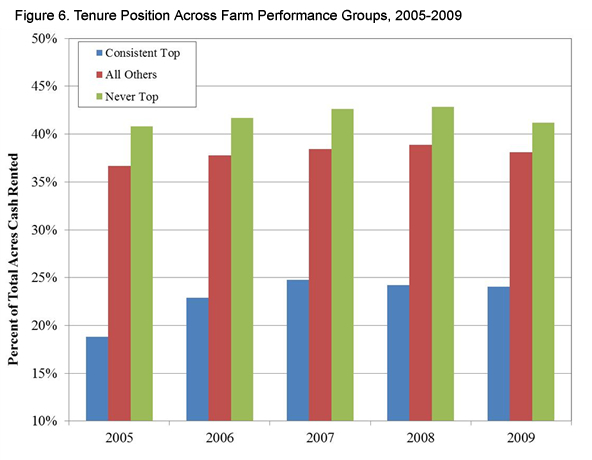
Finally, figures 5 and 6 examine the relationship between performance, farm size (as measured by total tillable acres), and farm tenure (as measured by % of total tillable acres cash rented), respectively. Farms consistently falling in the top quartile of management returns do tend to be slightly larger, with an average difference in farm size of approximately 200 acres. Note, however, that average acreage for consistent performers and farms who ranked in the top quartile for management returns at least once from 2005-2009 is very similar. Finally, there is also a significant difference in the tenure position of consistent performers and operations who failed to rank in the top quartile of returns over the 5 year period. Consistent performers tend to rent less than 25% of their total acreage using cash rent agreements, while other farms rent 35% to 40% of their land using cash rents.
Summary
Illinois grain farms were classified into three performance categories based on their management returns falling in the top quartile of all farm returns in a given crop year. A significant difference in management returns exists across performance groups. The biggest component of this difference is explained by differences in gross revenue, indicating the importance of productivity and marketing in consistent performance over time. Cost control is also important, with direct inputs and power costs accounting for significant portions of the difference in management returns between consistent performers and other farms. Finally, farm size and tenure are also show to differ across performance groups with consistent performers operating more acres and using cash rental agreements less intensively than other farms. Caveats include the specific time-period analyzed and the relatively small sample of farms falling in the consistent performer category relative to the other performance groups.
Disclaimer: We request all readers, electronic media and others follow our citation guidelines when re-posting articles from farmdoc daily. Guidelines are available here. The farmdoc daily website falls under University of Illinois copyright and intellectual property rights. For a detailed statement, please see the University of Illinois Copyright Information and Policies here.