Biotechnology and Variation in Average U.S. Yields
Introduction
In a previous article, we compared the trend in U.S. average yield per harvested acre for the 1940-1995 and 1996-2011 periods. The year 1996 was the first year that biotech varieties of crops were commercially adopted in the U.S. The analysis included 14 crops, 3 biotech crops (corn, cotton, and soybeans) and 11 crops for which adoption of biotech varieties is limited. This article specifically examines the deviation of average U.S. yield from its trend-line yield. The objective is to provide information concerning the commonly-expressed argument that biotechnology has reduced yield variability.
Analytical Procedures
The data for this analysis are from the U.S. Department of Agriculture, National Agricultural Statistics Service, accessed at http://www.nass.usda.gov/Data_and_Statistics/) during November 2011. The observation period is from 1940 through 2011, with 1940 being the approximate year that average yield began to increase for most U.S. crops.
We will use corn yields since 1995 to illustrate the calculation of yield variation used in this analysis. The yearly corn yield, along with the linear trend line, is presented in Figure 1. We calculated the percent deviation of the actual yield from the estimated trend-line yield for each year. For example, U.S. average corn yield was 160 bushels per harvested acre in 2004. The linear trend yield estimate for 2004 was 144. The percent deviation of yield from its trend yield estimate is +11% ((160/144) -1). In other words, average U.S. yield in 2004 was 11% greater than the trend yield for 2004. This measure of variation takes into account that yield has trended up over time. A one bushel variation in yield has a different meaning when yield is 150 bushels than when it is 50 bushels. The last step in the procedures was to calculate the standard deviation of the percent variations from trend-line yield during the observation period. Standard deviation is a commonly-used measure of variation.

Discussion
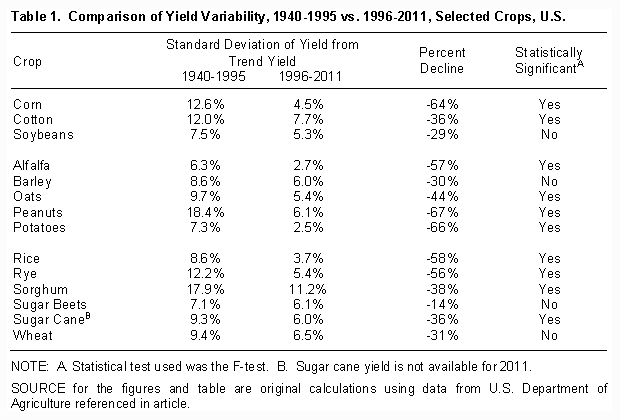
For all 14 crops, the variation from trend-line yield is lower during the recent 1996-2011 period than during the earlier 1940-1955 period (see Table 1 below). The average decline in yield variation was -45%, with a range from -14% (sugar beets) to -67% (peanuts). Moreover, for 10 of the 14 crops, yield variation was smaller in the more recent period with 95% statistical confidence (see last column of Table 1). The four exceptions were barley, soybeans, sugar beets, and wheat. Last, the average decline for the 3 biotech crops was -43%, compared with -45% for the 11 non-biotech crops.

Implications
A decline in yield variability is a universal characteristic of the U.S. crops included in this study. It is not just a characteristic of the biotech crops. Moreover, little difference appears to exist in the size of the decline in yield variability across biotech and non-biotech crops.
While this study cannot preclude biotechnology as an explanation for the decline in yield variability observed for corn, cotton, and soybeans; it suggests more universal factors are likely occurring. One such factor could be that both biotech and traditional breeding methods have been equally successful at creating varieties that reduce yield variation. A second such factor could be that weather was more favorable across the various U.S. production regions during 1996-2011 than 1940-1995.
To the extent that the decline in crop yield variability is permanent and not transitory, it generates benefits for consumers of crops. A more reliable supply reduces the size of stocks that need to be carried to assure an adequate supply of food before the next harvest, thus reducing the cost of food. A more reliable supply also enhances the ability to expand non-food uses of crops. Non-food uses, such as energy production, require large capital investments. Large capital investments are more economically viable when utilized at close to full capacity. A stable input supply increases the odds that a plant can operate closer to full capacity.
This paper is also available at http://aede.osu.edu/publications
Disclaimer: We request all readers, electronic media and others follow our citation guidelines when re-posting articles from farmdoc daily. Guidelines are available here. The farmdoc daily website falls under University of Illinois copyright and intellectual property rights. For a detailed statement, please see the University of Illinois Copyright Information and Policies here.


