


GRIP Payments in 2011
On February 23rd, the National Agricultural Statistical Service (NASS) released county corn and soybean yields for 2011 (see here). From these yields, 2011 Group Risk Income Plan (GRIP) payments can be estimated. For corn, GRIP with the harvest revenue option (GRIP-HR) at the 90% coverage level will make payments in 43% of Illinois counties while GRIP without the harvest price option (GRIP-NoHR) will pay in 20% percent of Illinois counties. For soybeans at the 90% coverage level, both GRIP-HR and GRIP-NoHR will pay in 49% of Illinois counties.
Corn Payments
Figure 1 shows estimated 2011 corn payments for corn at a 90% coverage level and a 100% protection level. In 2011, 96% of acres insured using GRIP-HR policies use the 90% coverage level. The 100% protection is the maximum protection level. Lower protection levels result in lower payments. Multiplying the protection level by the maximum payments in Figure 1 will yield an estimate of the GRIP-HR payment. For example, Macon County has a $161 payment at at 100% protection level. If an individual purchased at a 60% coverage level – the lowest possible protection level – the payment is $97 per acre ($161 x .60).
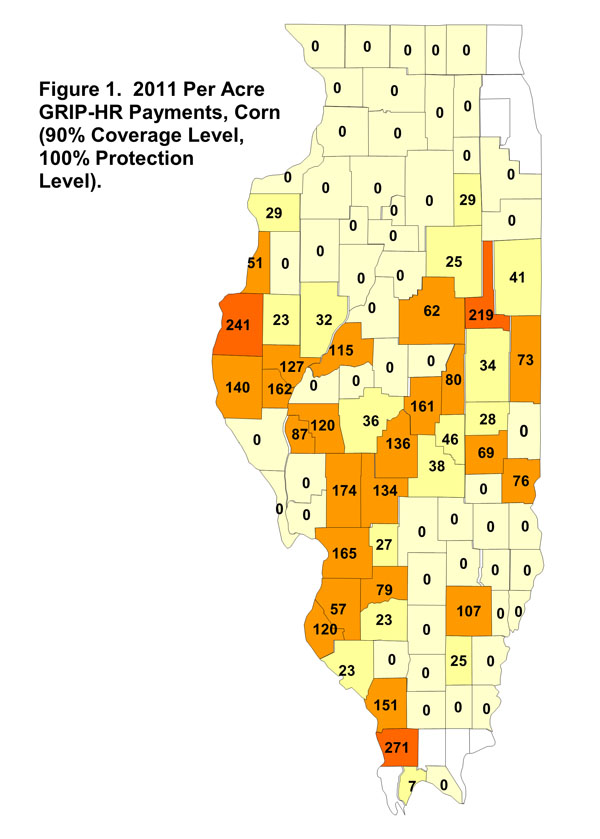
Counties receiving payments tend to be in central Illinois and southwest Illinois, with notable exceptions in southeast Illinois. Counties in northern Illinois did not receive payments (see Figure 1). Three counties have payments above $200 per acre: Union ($271 per acre), Hancock ($241), and Ford Counties ($219). Five counties had payments above $150 per acre but below $200 per acre: Macoupin (174 per acre), Madison (165), Brown (162), Macon ($161), and Jackson Counties (151).
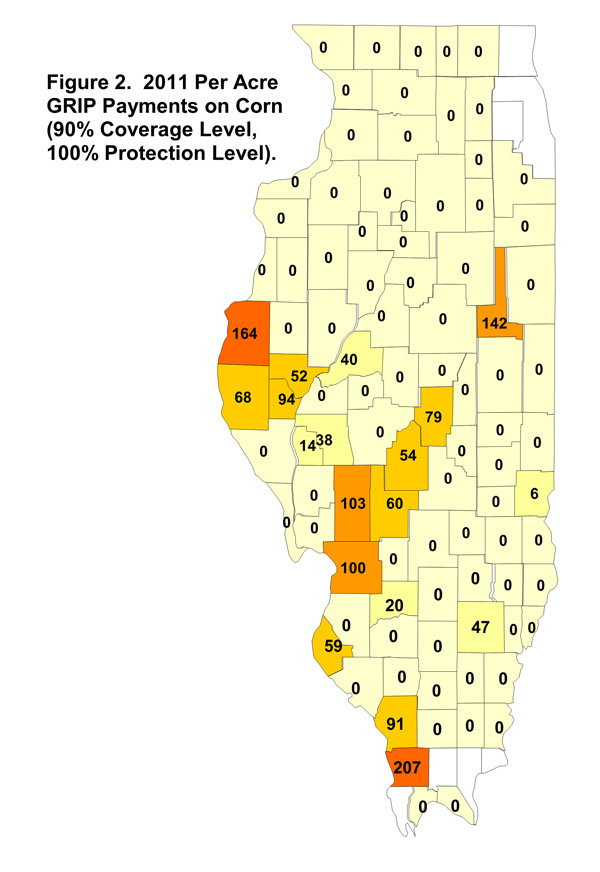
In 2011, the harvest price for corn of $6.32 was above the $6.01 projected price, causing GRIP-HR’s guarantees to be based on the $6.32 harvest price. As a result, GRIP-HR will make higher payments than GRIP-NoHR. GRIP-NoHR’s guarantee is based on the lower $6.01 projected price.
Figure 2 shows GRIP-NoHR payments for corn. As can be seen in Figure 2, considerably fewer counties receive payments. In those counties that receive payments, GRIP-HoHR payments are less. In Hancock County, for example, GRIP-NoHR has a $164 per acre. The $164 payment is 68% of the $241 per acre payment for GRIP-HR.
Soybean Payments
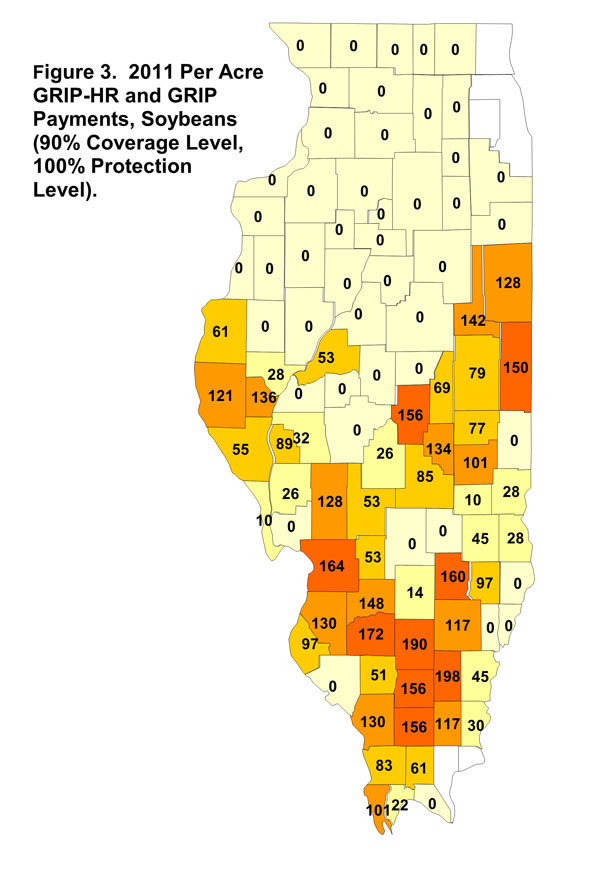
Figure 3 shows GRIP payments for soybeans at a 90% coverage level and 100% protection level. The soybean harvest price of $12.14 per bushel is below the projected price of $13.49 per bushel. Because harvest price is below projected price, GRIP-NoHR and GRIP-HR have the same payments for the same coverage and protection levels.
As can be seen in Figure 3, many central and southern Illinois counties receive GRIP payments for soybeans. Nine counties have payments above $150 per acre: Hamilton ($198 per acre), Jefferson ($190), Washington ($172), Madison ($164), XClay ($160), Williamson ($156), Macon ($156), Franklin ($156), and Vermilion ($150).
Summary
GRIP will make sizable payments in some counties. For corn, payments are primarily a result of yield losses. Soybean losses are a combination of lower prices and lower yields.
Disclaimer: We request all readers, electronic media and others follow our citation guidelines when re-posting articles from farmdoc daily. Guidelines are available here. The farmdoc daily website falls under University of Illinois copyright and intellectual property rights. For a detailed statement, please see the University of Illinois Copyright Information and Policies here.