


Freedom to Farm, Changes in Planted Acres, and Policy Observations
Background
An important change in U.S. farm policy occurred when the Federal Agriculture Improvement and Reform Act of 1996 eliminated acreage set asides. Supply controls had been a feature of U.S. farm policy since the Agricultural Adjustment of 1933. This article examines both the short and longer term changes in 2 aspects of managing a farm that resulted from the so-called “Freedom to Farm” provision:
- it allowed farms to increase planted acres by eliminating set asides, and
- it allowed farms, with some exceptions, to plant whatever crop was most profitable.
- In short, Freedom to Farm increased the management flexibility of U.S. farms.
Principal Crop Acres
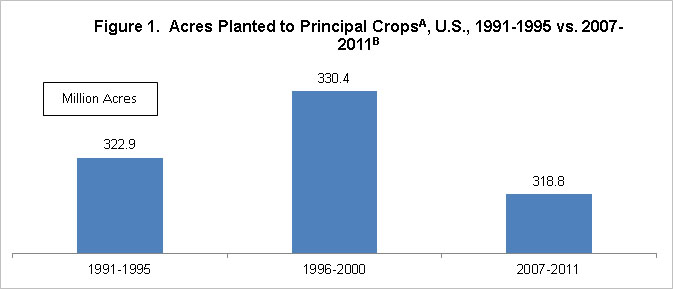
Principal crops include almost all crops except fruits, nuts, and vegetables. The Olympic average (excludes high and low values) of acres planted to principal crops was 322.9 million during 1991-1995, the 5 years before Freedom to Farm (see Figure 1). For the first 5 years of Freedom to Farm (1996-2000), average acres planted to principal crops increased by 7.5 million to 330.4 million. During 1991-1995, set asides averaged 3.6% per year per program crop subject to set asides, implying approximately 7 million acres were set aside annually. Thus, this increase in principal crop acres is consistent with the elimination of set asides.
Set asides were historically small during 1991-1995. As a comparison, set asides averaged 17.7% per crop per year during 1986-1990. The relatively small average set aside in 1991-1995 is consistent with a common policy observation: important policy changes often are made when their negative impacts are likely to be limited. The primary reason often cited for this observation is that supporters of a program find it harder to garner support for the program if its elimination will have limited negative impact. In this case, support for eliminating set asides began to build after the U.S. lost world market share in the demand collapse of the early 1980s. However, it was difficult for Congress to make this change when farmers were confronting a farm financial crisis and the U.S. was spending large amounts of money to support farm income. Set asides restricted supply, thus increasing price and limiting the cost of farm programs.
Policy changes have immediate impacts but also continue to interact with the private market after the initial change. Because of these interactions, it is difficult to isolate longer-term impacts of a policy change. Nevertheless, it is useful to note longer term changes in variables impacted directly by a policy change. Specifically for Freedom to Farm, the Olympic average of acres planted to principal crops was 318.8 million during the most recent 5 years (2007-2011). This is 4.1 million fewer acres than during 1991-1995.
The long-term decline in U.S. principal crop acres since Freedom to Farm likely reflects several factors, such as higher yields and increasing production in South America and the Former Soviet Union. While this is a topic for future investigation, it is worth noting that from 1996-2000 to 2007-2011 acres planted to wheat, cotton, sorghum, barley, and oats declined by, respectively, 8.3, 4.1, 3.0, 2.8 and 1.5 million.
Mix of Program Crops
Since Freedom to Farm increased the flexibility of farm?s to decide what crops to produce, the importance of corn and soybeans in the U.S. crop mix has increased. In 2007-2011, corn and soybeans accounted for 51.8% of principal crop acres up 9.4 percentage points from their 42.4% share in 1991-1995 (see Figure 2). The increase came largely from other program crops, notably wheat and the other feed grains (barley, oats, and sorghum). The majority of soybean?s increase in share occurred immediately after Freedom to Farm was enacted: from 18.7% in 1991-1995 to 21.8% in 1996-2000. In contrast, the majority of corn?s increased share occurred after 2000: from 24.9% in 1996-2000 to 28.0% in 2007-2011. Corn?s increasing share since 2000 is not likely a consequence of Freedom to Farm, as it coincides with the large increase in ethanol production.

To simplify the presentation of the shift in acres across geography, Table 1 lists only the 26 state-crop combinations whose share of U.S. acres planted to corn, soybeans, and wheat changed by more than 0.5% from 1991-1995 to 2007-2011. The discussion is limited to these 3 crops because their share of principal crop acres changed the most.
Before discussing the information in Table 1, it is important to note that data were available for a total of 112 state-crop combinations. Thus, since 1991-1995, over three quarters of state-crop combinations have experienced only limited change in their share of U.S. acres planted to corn, soybeans, and wheat. It is also important to note that a declining share of U.S. acres does not mean that acres decreased in a state. For example, although Iowa?s share of U.S. corn acres declined by 1.2% from 1991-1995 to 2007-2011, the number of acres planted to corn in Iowa increased from 12.5 million in 1991-1995 to 13.7 million in 2007-2011. The reason that Iowa?s share declined is that acres increased relatively more in other states, such as Kansas and North and South Dakota.

Corn and soybean acres shifted from states in the Corn Belt to states in the Plains. Soybean acres also shifted from states in the lower Mississippi river delta area to states in the Plains. Wheat acres largely shifted among states west of the Mississippi. Shifts among states are somewhat more pronounced for soybeans than for corn and wheat, with North Dakota?s increase and Illinois? decrease in share of U.S. soybean acres notable. The shifts in acres among states are likely due to a number of factors, such as differential change in yield growth, and are a topic for future investigation.
Summary Policy Observations
It is reasonable to speculate that supporters of eliminating acreage set asides probably did not expect that acres planted to principal crops in the U.S. would be fewer now than in the period preceding Freedom to Farm. This observation is not a judgment on eliminating set asides, but a statement that expected long term impacts of policy changes can often be overrun by other factors. Stated alternatively, because policy changes interact with other factors, it is difficult to anticipate how they will turn out, especially over the longer term. Moreover, it can be difficult for researchers to assess the impact of policy changes, even from a historical perspective. The difficulty in predicting and understanding the impact of policy and policy changes is one reason that farm policy is constantly in need of updates by Congress and thus is one of the reasons why we revisit the Farm Bill on a regular basis.
This article is also available at http://aede.osu.edu/publications
References
For all Figures and Tables
NOTES: (A) Principal crops are corn, sorghum, oats, barley, winter wheat, rye, durum wheat, other spring wheat, rice, soybeans, peanuts, sunflower, cotton, dry edible beans, potatoes, and sugar beets. Principal crop acres also include harvested acres for all hay, tobacco, and sugarcane. (B) Olympic average is calculated for each period (low and high value removed).
SOURCE: original calculations using data from the U.S. Department of Agriculture, National Agricultural Statistics Service, available at http://www.nass.usda.gov/Data_and_Statistics/Quick_Stats/index.asp
Disclaimer: We request all readers, electronic media and others follow our citation guidelines when re-posting articles from farmdoc daily. Guidelines are available here. The farmdoc daily website falls under University of Illinois copyright and intellectual property rights. For a detailed statement, please see the University of Illinois Copyright Information and Policies here.