


Little Change in Where Corn is Planted in the United States
On March 31st, the U.S. Department of Agriculture reported that 95.9 million acres of corn are projected to be planted in 2012. If these acres are planted, the 95.9 million acres will be 3.9 million acres more than were planted in 2011 and 16.7 million more acres than the average 2001-2005 plantings. Prospective 2012 planted acres are 21 percent higher than the 2001-05 average. While planted acres have increased, where corn is produced in the United States has not changed much. Over the past decade, there have been modest shift in plantings from the eastern to western corn-belt. North Dakota has increased share of acres. Overall though, there is remarkable stability in shares of planted corn acres across states. This suggests that national expected yield should not change much because of where corn is planted and that continued planting of 95.9 million or more acres of corn depends on success with more corn intense rotations.
Ranks and Shares of Planted Acres by State

In its March 31st report, USDA listed prospective 2012 plantings by state (see Figure 1). The six states with the most acres are:
- Iowa with 14.6 million acres,
- Illinois with 12.5 million acres,
- Nebraska with 10.3 million acres,
- Minnesota with 8.7 million acres,
- Indiana with 6.1 million acres, and
- South Dakota with 5.5 million acres.
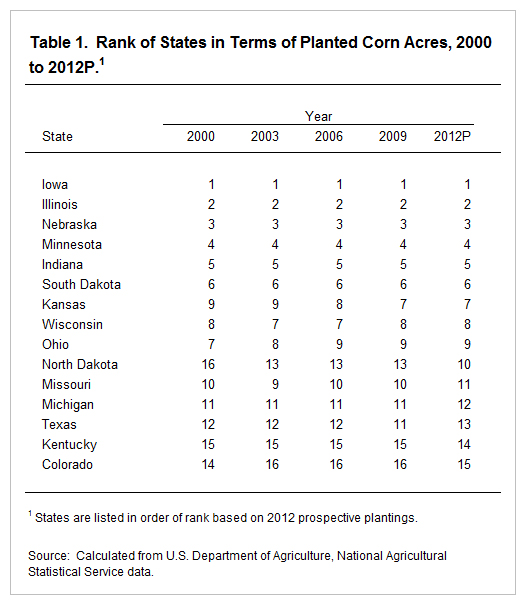
These six states have had the same rank in terms of planted acres in each year since 2000 (see Table 1). In other words, Iowa has had the most acres in each year since 2000, Illinois the second most number of acres, and so on. For the top 15 ranked states in 2012, there have had relatively minor shifts in ranks between 2000 and 2012. When ranks are compared between 2000 and 2012, only North Dakota changed ranks by more than two places.
North Dakota increased its rank from 16 in 2000 up to 10 in 2012. In 2000, 1.1 million acres of corn were planted North Dakota. Planted acres then doubled to 2.2 million acres in 2011. In 2012, planted acres are projected at 3.4 million acres, an increase of 1.2 million acres over 2011. This would represent a 52 percent increase in planted corn acres in North Dakota between 2011 and 2012.
As one would expect given that ranks are stable, differences in state’s shares of production between 2000 and 2012 are small (see Table 2). For example, Iowa planted 25 percent of the acres in the U.S. during 2000. In 2012, Iowa’s projected plantings of corn are 25 percent of production, exactly the same share as in 2000. Of the 15 largest corn planting states, seven did not have a share change between 2000 and 2012: Iowa, Minnesota, Wisconsin, Ohio, Missouri, Kentucky, and Colorado (see final column of Table 2). Three states had decreases: Illinois, Indiana, and Texas each had a decrease of 1 percentage point. Four states had increases: North Dakota with a 4 percentage point increase and Nebraska, South Dakota, and Kansas, and Michigan each had a 1 percentage point increase.
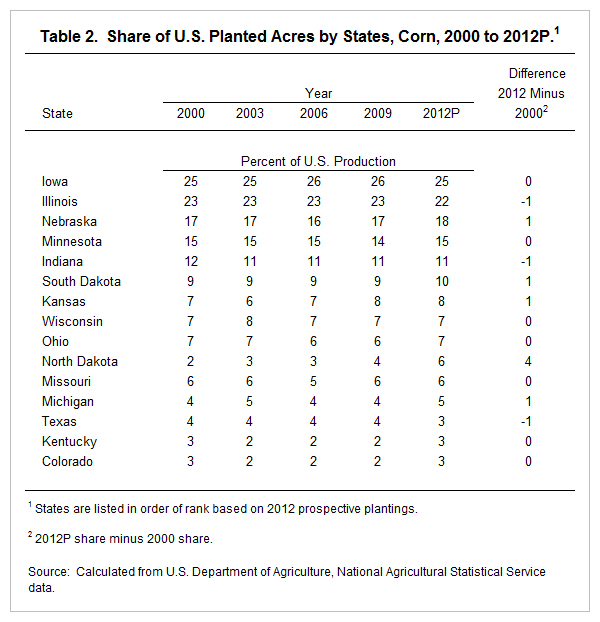
Those states that gained and lost share suggests a regional shift in production in the corn-belt. The eastern corn-belt has lost share while the western corn-belt has gained share. The eastern corn-belt – which includes Illinois, Indiana, Ohio, and Michigan – decreased from 46 percent share in 2000 to 43 percent share in 2012. The western corn-belt – which includes Iowa, Nebraska, Minnesota, South Dakota, Wisconsin, and North Dakota – increased from 75 percent to 81 percent in 2012. Much of the 6 percent increase in the western corn-belt share is due to North Dakota. Taking out North Dakota from the western corn-belt reduces the increase from a 6 percentage point changed down to a 2 percentage point change.
Summary and Implications
Stable shares across states have two implications. First, most of the increase in corn planting is not occurring in new areas where corn has not been produced before. Rather corn plantings are becoming more intense in areas where corn has been produced before. As a result, land productivity where corn is being grown has not changed much over time. As planted acres increase, this suggests that national expected yield per acre because of productivity changes in farmland. However, national expected yield per acre may change because use of more intense corn rotations could impact yields.
Second, whether 95.9 million or more acres will be planted in future years will depend on the success of more corn intense rotations. Gains in corn acres largely are the result of corn being planted on the same farmland in more years. This then leads to corn being planted on farmland that was planted to corn in the previous year to corn (i.e., corn-after-corn). Agronomic research points to corn-after-corn having lower yields than corn following another crop. If corn-after-corn yield drags can be kept to a minimum, thereby making corn-after-corn a profitable alternative, plantings of more than 95.9 acres will continue to occur.
It is interesting to note that the one major state without an increase in planted acres is Illinois. Illinois planted 12.6 million acres in 2011 and is projected to plant 12.5 million acres in 2012. In parts of Illinois, hot and dry conditions existed in 2010 and 2011. During this same period, corn-after-corn had substantially lower yields compared to corn-after-soybeans on many farms, sometimes with corn-after-corn yields being 30 bushels or more lower than corn-after-soybean yields. This recent experience with much lower corn-after-corn yields may have led to corn not increasing in acres in Illinois. Corn-after-corn yields generally are viewed to decline more in stress conditions than corn-after-soybeans yields. In recent years, many areas of the corn-belt have not seen as stressful conditions as those experienced in parts of Illinois. Perceptions of corn-after-corn yield drags may differ across the corn-belt depending on whether stressful conditions have been faced in recent years. Perceptions and planting decisions may change when drought conditions are faced in other areas of the corn-belt.
Disclaimer: We request all readers, electronic media and others follow our citation guidelines when re-posting articles from farmdoc daily. Guidelines are available here. The farmdoc daily website falls under University of Illinois copyright and intellectual property rights. For a detailed statement, please see the University of Illinois Copyright Information and Policies here.