Impacts of Limits on Crop Insurance Risk Subsidies
Discussion has centered on limiting crop insurance risk subsidies. In a March 2012 report, for example, the General Accounting Office (GAO) used a $40,000 limit on risk subsidies to calculate the number of farms impacted by the limit (see here). In this post, the acres required to reach a $40,000 limit is examined for Illinois farms. Because risk subsidies vary by year, acres required to reach the limit also will vary. Between 2006 and 2012, acres required to reach the limit for average farms in Illinois are between 1,600 and 2,700 acres, not particularly large grain farms. More detail on risk subsidies and acre limits are provided in the following sections.
Premiums and Risk Subsidies on Federal Crop Insurance
The Risk Management Agency (RMA) administers Federal crop insurance products and sets premiums associated with polices. When setting premiums, RMA attempts to set premiums so that those premiums cover expected insurance payments. Over time, total premiums from policies should roughly equal insurance payments. In some years, total premiums will be larger than insurance payments. In other years, total premium will be below insurance payment as adverse events cause payments to exceed premium. Over time, total premium should equal insurance payments.
Farmers do not pay the total premium associated with Federal crop insurance. A portion of the premium, known as the risk subsidy, is paid by the Federal government. Subtracting the risk subsidy from the total premium gives the farmer-paid portion of premium.
Risk subsidies do not go to farmers. Instead, risk subsidies, along with the farmer-paid premiums, flow to crop insurance companies. Crop insurance companies use total premiums to 1) reinsure policies with the Federal government and private insurers, 2) make insurance payments to farmers and 3) build reserves for insurance payments in the future. Any excess (deficit) after performing these three functions contribute to profits (losses) of crop insurance companies.

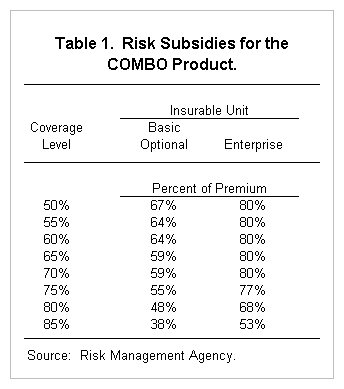
Risk subsidies are determined by Federal legislation and are stated as a percent of total premium. Percentages vary by unit insured and coverage level, as illustrated in Table 1 which shows risk subsidies for the COMBO product. As can be seen, enterprise units have higher risk subsidy rates than basic and optional units. At an 80% coverage level, for example, the risk subsidy rate is 68% for enterprise units and 48% for basic and optional units. Subsidy levels decrease with higher coverage levels. For enterprise units, for example, the subsidy rate is 80% for 70% and lower coverage levels. Subsidy rates are 77% for the 75% coverage level, 68% for the 80% coverage level, and 53% for the 85% coverage level.
To illustrate premium setting, take a 2012 Revenue Protection (RP) policy at an 80% coverage level for a 400 acre enterprise unit having an 187 Trend Adjusted Actual Production History (TA APH) yield. This product has a total premium of $33 per acre. The risk subsidy is $22.44 per acre ($33 total premium x .68 risk subsidy). The farmer-paid premium is $10.56 per acre ($33 total premium – $22.44 risk subsidy)
The GAO is discussing setting a limit on the size of risk subsidies. The specific limit mentioned in the GAO report was $40,000. If this limit came into existence, farmers would presumably have to pay the balance of the risk subsidy to the crop insurance companies. If a famer purchased crop insurance having $50,000 of risk subsidy, the farmer would have to pay the $10,000 of risk subsidy above the $40,000 limit.
Risk Subsidies From 2001 Through 2011
Per acre risk subsidies average $7.70 per insured acre from 2001 through 2005 for corn, soybeans, and wheat in Illinois. Since, 2006, per acre risk subsidies have increased. Per acre risk subsidies average $22 per acre in 2009, $18 per acre in 2010, and $29 per acre in 2011 (see Figure 1).

Risk subsidies as a percent of total premium have been relatively stable for corn, soybeans, and wheat over the past decade, with a low of 51% in 2008 and a high of 56% in 2012. Hence, most of the changes in per acre risk subsidies in Illinois have been due to total premium changes. As total premiums increase, risk subsidies increase as well.

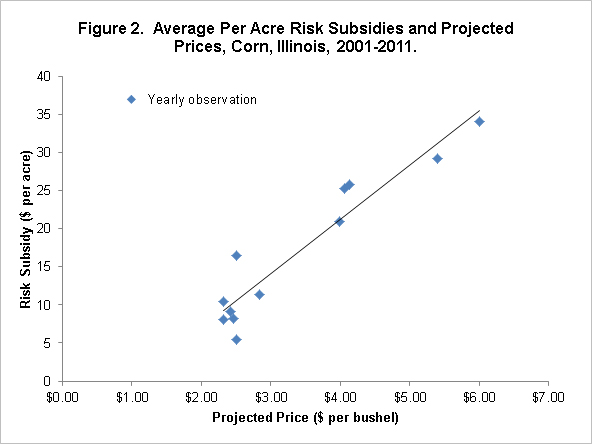
The predominant factor influencing total premiums have been projected prices. Higher projected prices result in higher insurance guarantees, thereby increasing total premium. Figure 2 illustrate this by showing a scatter gram of average per acre risk subsidies for corn in Illinois arrayed against projected prices. There is a positive, linear relationship between projected prices and per acre risk subsidies.
Per acre risk subsidies in 2012 likely will be 20% to 30% lower than in 2011 for two reasons. First, projected prices are lower in 2012 compared to 2011. The 2011 projected price was $6.01, the highest projected price in history. In 2012, the projected price is $5.68 per bushel. Second, RMA has begun a process of reducing corn and soybean premiums over much of the Midwest. These reductions are being implemented because premiums for corn and soybeans have been higher than insurance premiums. As total premiums are reduced, risk subsidies will decrease as well.
Acres to Reach a $40,000 Risk Subsidy Limit
The GAO proposes a $40,000 limit per individual or entity. Acres to reach the $40,000 limit are calculated below. One farm operation may have more than one individual involved in the operation. If there are two individuals involved, presumably there would be two $40,000 limits. Acres required to reach this limit will vary by year as per acre risk subsidies vary by year. Acres to reach the $40,000 limit are calculated for 2007 through 2011 using the per acre risk subsidies shown in Figure 1.
A per acre adjustment is made to account for share rent acres. Generally, farmers will only pay insurance premiums on their share of production. On a 50-50 share-rent acre, the farmer would pay 50% of the premium. Hence, the risk subsidy on a share rent acre will be 50% of an owned or cash rent. According to Illinois Farm Business Farm Management records, share rent occurred on 36% of acres. It is assumed that the famer will pay 100% on owned and cash rent acre and 50% on share rent acres. This leads to an adjustment factor of .82 (.64 acres owned or cash rent x 1.00 premium share + .36 acres share rent x .50 premium share). The .82 adjustment factor will increase farm size to reach the $40,000 limit. Tenure will impact acres needed. Farms with all owned or cash rent acres will reach the limit with fewer acres than farms with more share rent acres.
Acres to reach the $40,000 limit are:
- 2007: 2,439 acres = $40,000 limit / ($20 per acre risk subsidy x .82 adjustment factor)
- 2008: 1,876 acres =$40,000 limit / ($26 per acre risk subsidy x .82 adjustment factor)
- 2009: 2,217 acres = $40,000 limit / ($22 per acre risk subsidy x .82 adjustment factor)
- 2010: 2,710 acres = $40,000 limit / ($18 per acre risk subsidy x .82 adjustment factor)
- 2011: 1,682 acres = $40,000 limit / ($29 per acre risk subsidy x .82 adjustment factor)
Acres to reach the limit will vary from farm to farm, with differences in crop insurance choice and tenure arrangements.
Commentary on $40,000 Limit
Four comments relative to a $40,000 acre limit:
- Acres required to reach the $40,000 limit will result in a grain farm above the average size, but the acres size would not be particularly large by grain farm standards. The average size of grain farms enrolled in FBFM in 2011 is 1,180 acres. A significant number of family farms with one full-time operator would exceed acre limits between 1,800 and 2,700 acres. This limit would likely be first encountered by sole proprietors who have few individuals involved in the operation.
- Up to this point, crop insurance programs have been relatively size neutral. Introduction of a size limit would limit risk protection offered to large farms. Making this move would be a departure from previous efforts by RMA.
- Accurateness of rate setting by RMA always is important. Assuring that total premiums equal the expected costs would become even more critical when limits are placed on rate setting.
- A payment limit could have differential impacts on farms. Fewer acres would be required in areas of higher risk, as premiums are higher in high risk areas. Farms with higher amounts of cash rental acres will reach the dollar limit faster than farms with share rent acres. In general, total premiums are higher for higher risk situations. Since risk subsidies are a percent of total premium, farms in riskier situation will reach limits quicker than farms in less risky situations.
Disclaimer: We request all readers, electronic media and others follow our citation guidelines when re-posting articles from farmdoc daily. Guidelines are available here. The farmdoc daily website falls under University of Illinois copyright and intellectual property rights. For a detailed statement, please see the University of Illinois Copyright Information and Policies here.


