


What is a Reasonable Starting Point for Estimating the U.S. Corn Yield in 2012?
The magnitude of the U.S. average corn yield in 2012 will be one of the most important factors in determining the average price during the 2012-13 marketing year due to the relatively low level of carry-out from the current marketing year. Early in the season, yield expectations generally start with an analysis of the trend in historic yields and an extension of the trend into the current year. As the planting and growing season progress, yield expectations are modified by the timeliness of planting, weather developments, and USDA crop condition ratings. The USDA provides survey based yield estimates beginning in August. See this publication for a detailed discussion of the procedures used by the USDA to produce the survey estimates.
At this still early point in the growing season, corn yield forecasts focus on trend yield, which can be thought of as average improvement in yield over time due to improvements in plant genetics and production technology. Analysis of the trend in the U.S average corn yield would seem to be a straight-forward exercise, but there is in fact considerable variation in how that analysis is conducted. The calculation of the value of the 2012 average U.S. trend yield, for example, can vary depending on:
- The form of the fitted trend (linear or non-linear),
- The starting date for calculating the trend,
- The ending date for calculating the trend, and
- Whether any historic yields are excluded from the trend calculation.
Most analysts fit a linear trend to historic yields, but the starting date for calculating the trend varies depending on whether there has been a perceived change in the trend over time. Most common is the perception that average yields have been increasing more rapidly since sometime in the 1990’s as compared to the 2 or 3 decades earlier. The perceived higher trend has been mostly attributed to the development and adoption of new plant genetics and/or traits. One of the difficulties of identifying trend shifts in the short term is the potential for other factors, such as extended periods of favorable or unfavorable weather, to impact yields for multiple years.
Sometimes a few historic yields are excluded from the trend analysis with the explanation that such yields were “outliers” that are not likely to re-occur in the future. For corn, candidates for exclusion are typically low yields associated with unique weather events (drought, flood, or freeze) or widespread disease. It is rarer for high yielding years to be eliminated from the analysis.
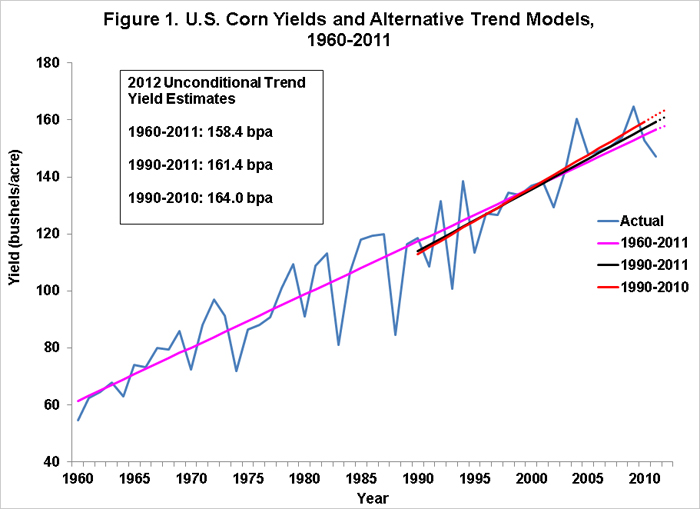
With this background, we can proceed to a discussion of alternative estimates of the 2012 U.S. corn trend yield. All calculations are based on actual yields without any adjustment for variation in weather conditions from year-to-year (unconditional yields). The first estimate was presented last week by the USDA in the May 10 WASDE report. It is important to emphasize that this estimate was not generated by a survey process. Instead, the report indicated that the forecast of the 2012 U.S. corn yield of 166 bushels was “based on the simple linear trend of the national average yield for 1990-2010 adjusted for planting progress.” (page 12) Notice that the calculation excludes 2011 from the analysis and simply extends the 1990 through 2010 trend two years to 2012. This results in a USDA trend yield calculation for 2012 of 164 bushels. The trend line is reproduced in Figure 1 (red line). It has a slope of 2.32, indicating that the trend increase in corn yields was 2.32 bushels per year from 1990 through 2010. The same report (page 2) indicated that the 164 bushel trend yield forecast was increased 2 bushels to 166 bushels to reflect the rapid pace of planting and emergence this spring.
In their report, the USDA did not indicate why the trend calculation was started in 1990 or why 2011 was excluded from the trend analysis. While there is a legitimate argument about the initial year to use for trend estimation, dropping 2011, a low yield year, from the estimation is more than a little curious. This seemingly small deletion turns out to have a large impact on the trend yield estimate for 2012. Adding back in 2011 to the USDA sample lowers the 2012 trend yield estimate 2.6 bushels to 161.4 bushels per acre (black line in Figure 1). The estimate for 1990-2011 reflects a trend yield increase of 2.15 bushels per year.
To illustrate the impact of the starting date on the trend calculation, we also calculate the trend yield for 2012 based on the linear trend of actual average yields from 1960 through 2011. The longer time period reflects the view that a notable change in the U.S trend yield has not occurred since 1960. Based on that time period, the trend calculation for 2012 is 158.4 bushels, reflecting a long term trend yield increase of 1.86 bushels per year (magenta line in Figure 1).
So, what do we think is a reasonable starting point for estimating the U.S. average corn yield in 2012? As we discussed in a previous post, there is indeed evidence of a slight increase in corn trend yield in some areas of the country in recent years, but we cannot yet confirm an increase in the overall U.S. average trend yield. So, we begin with the long term trend estimated over 1960-2011. We then “de-trend” historic yields over 1960-2011 in terms of 2012 technology. Next, we drop 1988 (early extreme drought conditions) and 1993 (historic flooding in western Corn Belt) from the analysis based on the argument that these are extreme outliers unlikely to be repeated in 2012. Finally, we add 2 bushels per acre to reflect the potential impact of the timely planting of the 2012 crop.
The 50 de-trended yields are presented in Figure 2 after re-arranging the yields from lowest to highest. The average de-trended and planting date adjusted corn yield for those years is 161.4 bushels per acre (coincidentally, the same as the trend yield over 1990-2011). Of particular interest is the chance that yields will equal or exceed the recent USDA estimate of 166 bushels per acre. Our analysis indicates that the average yield would equal or exceed 166 bushels in only 16 of the 50 years, or about one-third of the time.

Summary
The seemingly arcane topic of corn trend yield estimation can have large market impacts in certain situations. 2012 is one of those situations. The USDA recently estimated the corn trend yield for 2012 (after adjusting for planting progress) at 166 bushels per acre. Our analysis, based on the long-term trend increase in U.S. average corn yields, is that a more reasonable estimate is 161.4 bushels per acre. Using the USDA estimate of 89.1 million harvested acres of corn in 2012, the difference in the two yield estimates represents over 400 million bushels. Furthermore, our analysis indicates there is only about a one in three chance that the U.S. average yield in 2012 will equal or exceed 166 bushels per acre. The USDA estimated yield is likely to require favorable summer weather consisting of below average temperatures and above average rainfall in the main producing areas.
Disclaimer: We request all readers, electronic media and others follow our citation guidelines when re-posting articles from farmdoc daily. Guidelines are available here. The farmdoc daily website falls under University of Illinois copyright and intellectual property rights. For a detailed statement, please see the University of Illinois Copyright Information and Policies here.