


The Impact of the 2012 Drought on Corn and Soybean Yield Updates for the PLC Program
The House Ag Committee’s 2012 Farm Bill allows farmers to choose between a fixed price support program (PLC) or a county-level revenue program (RLC). A summary of the House bill can be found here and more info on the PLC program is available here. The price program, referred to as Price Loss Coverage or PLC, has a similar design to that of the current counter-cyclical program (CCP). Exceptions are that PLC would provide payments based on planted (rather than base) acres, and PLC reference prices are set above current CCP target prices. In addition, producers will have the option of updating their current CCP payment yields.
Updated payment yields for the PLC program are calculated as 90 percent of the average of farm yields over the 2008 to 2012 crop years. Current CCP payment yields were calculated based on historical yields prior to either the 1996 or 2002 farm bills. For crops such as corn and soybeans, increases in productivity over time – or yield trends – would imply that producers of these crops in most regions would be able to benefit by opting to update yields. However, the 2012 drought will result in corn and soybean yields falling well below trend in most regions of the U.S.
Using program data from the Farm Service Agency and historical and 2012 estimated yield data from the National Ag Statistics Service (based on the August crop report), average current CCP and updated PLC payment yields were estimated for corn and soybeans in top production states. Figure 1 maps the ratio of updated to current payment yields for corn. A ratio greater than 1 means that the average updated PLC yield in that state is estimated to exceed the average CCP yield, implying that the majority of corn producers in that state would benefit from updating. Of the 18 states included in the map in figure 1, 10 states have a ratio greater than 1. The remaining 8 states with a ratio below 1 include Indiana, Missouri, and Kansas where the drought has led to 2012 corn yield estimates that are 35% to 45% below trend levels.
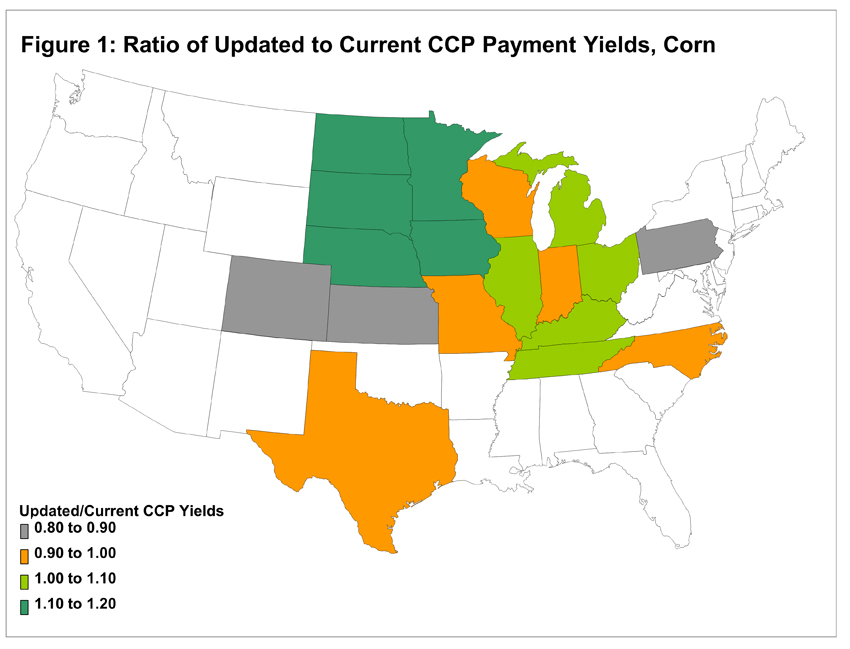
Figure 2 maps the updated to current payment yield ratio for the top soybean producing states. All but 3 of the 18 states have estimated ratios greater than 1. Estimates for updated payment yields in Minnesota, North Dakota, and South Dakota fall just below estimates of current CCP yield levels. Despite expectations for 2012 soybean yields significantly below trend in Kansas, Kentucky, Missouri, and Tennessee (>25% below trend), updated yields in these states are above average CCP yields due to large increases in productivity since the current payment yields were established. In the middle of the corn belt, soybean yields are expected to be between 20% and 25% below trend, but productivity increases and resulting higher yields from 2007 to 2011 result in larger updated payment yields. Updated payment yields in Nebraska and a number of southeastern states are estimated to exceed current CCP yields by more than 20%.

If 2012 yields were removed from the average used for updating, updated payment yields would increase for all but 5 of the corn producing states (Colorado, Kansas, North Carolina, Pennsylvania, and Texas). Updated payment yields for corn in these would be up to10% larger if 2012 yield estimates were removed and updated yields were based on an average from 2007 to 2011. For soybeans, all but 2 states (Minnesota and North Dakota) would have higher updated yields if estimated 2012 soybean yields were excluded. Updated soybean payment yields estimated using an average of 2007 to 2011 yields would increase by up to 5% relative to the stated updated rule which includes 2012 yields.
Note that current CCP and updated PLC yields at the farm-level will vary from the state-level averages used in this article. If the PLC program is a part of the final 2012 Farm Bill and yield updating is allowed, producers should assess their situations on a farm-by-farm basis by comparing their current CCP yields to updated payment yields. There will be individual farms that will be able to increase payment yields by updating even in states where the average updated yield is below the current CCP average yield. Similarly, there will be individual farms where updating will not increase their payment yields even in states where the ratio of average updated to current CCP yields exceeds 1.
Disclaimer: We request all readers, electronic media and others follow our citation guidelines when re-posting articles from farmdoc daily. Guidelines are available here. The farmdoc daily website falls under University of Illinois copyright and intellectual property rights. For a detailed statement, please see the University of Illinois Copyright Information and Policies here.