


2012 Harvest Prices for Corn and Soybeans: Implications for Crop Insurance Payments
The 2012 crop insurance harvest prices will be $7.50 per bushel for corn and $15.39 per bushel for soybeans (As of this writing, the Risk Management Agency has not officially released these prices). These harvest prices are considerably above projected prices, with increases begin large by historical standards. As illustrated below, Revenue Protection (RP) and Group Risk Income Plan with the Harvest Price option (GRIP-HR) insurance policies will make large payments under low yield scenarios.
Harvest Prices Compared to Projected Prices
The $7.50 harvest price for corn is $1.32 above the $5.68 projected price, representing a 32 percent increase. This 2012 harvest price increase is the third largest since 1975 (see Figure 1). The largest increase occurred in 2010, when the $5.46 harvest price was 37% above the $3.99 projected price. The second largest increase occurred in 1988, when the harvest price of $2.89 was 33% above the projected price. The 2012 and 1988 increases are of similar magnitude.

The $15.39 harvest price for soybeans is $2.84 above the $12.55 projected price, representing a 23% increase. The 2012 harvest price increase is the sixth largest since 1975. Years with larger price increases include 2003 (39% increase), 1983 (33% increase), 1976 (26% increase), 2010 (26% increase), and 1988 (23% increase). The 2012 and 1988 increases are of similar magnitude.

Revenue Protection Payments
Because the harvest price is above the projected price, RP insurance payments will occur when the harvest yield is below the guarantee yield, with the guarantee yield equaling the Trend Adjusted Actual Production History (TA APH) yield times the coverage level. For corn, payment on shortfalls will be the $7.50 harvest price times the yield shortfall. Take a farm with a 200 bushel TA APH yield and an 85% coverage level, giving a guarantee yield of 170 bushel per acre (200 TA APH yield x .85). A 150 bushel harvest yield results in a 20 bushel yield shortfall (170 guarantee yield – 150 bushel TA APH yield) and a payment of $150 per acre (20 bushel yield shortfall x $7.50 price).
Table 1 shows payments for corn given different guarantee and harvest yields. Payments will be large at low yields, helping to offset revenue losses associated with low yields.
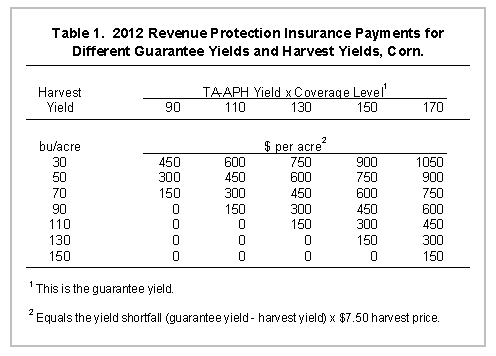
Table 2 show payments for soybeans given different guarantee and harvest yields. Similar to corn, payments will be large at low yields, helping to offset revenue losses associated with low yields.

Group Risk Income Plan with Harvest Revenue Option (GRIP-HR) Payments
County yields for 2012 are not available. Hence, GRIP-HR payments cannot be determined. Some feel for the size of the GRIP-HR payments can be gained by simulating GRIP-HR payments at the Crop Reporting District (CRD) level, using estimates of 2012 CRD yields, which have been preliminarily released by the US Department of Agriculture. Table 3 shows simulated payments at the CRD level for both corn and soybeans at a 90% coverage level. These payments are at a 100% protection level. Lower protection levels result in lower payments. For example the Northwest CRD simulated payment of $438 per acre at a 100% coverage level become $263 per acre at 60% coverage level ($263 = $438 x .60). Note that county payments could vary substantially from the CRD estimates shown in Table 1, as county yields will vary across the CRD.

Using simulated GRIP-HR payments as a guide, 2012 GRIP-HR payments will be large in some areas. The range of estimated payments is from a low of $312 per acre for the West CRD up to a high of $865 per acre for the Southeast CRD.
Soybean GRIP-HR payments will be lower than for corn. Simulated payments range from a low of $0 per acre for the Northwest and Northeast CRDs up to $187 per acre for the Southeast CRD.
Summary
Low yields across much of the Illinois will result in crop insurance payments. These payments will cover revenue losses caused by low yields from the drought. With the release of harvest prices, more accurate estimates of crop insurance payments can be obtained.
Disclaimer: We request all readers, electronic media and others follow our citation guidelines when re-posting articles from farmdoc daily. Guidelines are available here. The farmdoc daily website falls under University of Illinois copyright and intellectual property rights. For a detailed statement, please see the University of Illinois Copyright Information and Policies here.