


Relationship between Crop Returns and Acreage Decisions
Relative corn and soybean prices over the past few crop years have encouraged expansion of corn acreage and the use of more corn intensive rotations throughout much of the Midwest. In general, and in central and northern Illinois in particular, increased corn acreage has come at the expense of fewer acres being planted to soybeans and, to a lesser extent, wheat.
This post examines whether this shift in crop rotations has led to increased returns for grain farms in Illinois. The figures are based on data provided by the Illinois Farm Business Farm Management Association (IL FBFM), and includes grain operations with at least 200 tillable acres located in the Northwest, Northeast, West, East, and Central crop reporting districts.
Figure 1 illustrates the shift in the use of soybeans in Illinois crop rotations from 1995 to 2011. From 1995 through 2006, an average of 25% of the grain operations in Illinois planted a crop rotation where at least 50% of the acreage was allocated to soybeans. Roughly 55% of Illinois grain operations allocated between 35% and 50% of their acreage to soybeans, and the remaining 20% used soybeans less intensively in their rotation with less than 35% of their acreage planted to soybeans. From 2007 to 2011 we’ve seen a significant increase in the proportion of farm operations planting more corn acres and fewer soybean acres. In 2010 and 2011 less than 10% of IL FBFM grain farms planted more than 50% of their acres to soybeans. Approximately 30% planted between 35% and 50% of their acres to soybeans, and just over 60% of farms planted less than 35% of their acreage to soybeans. These figures indicate a significant shift towards continuous corn and corn-corn-soybean rotations.

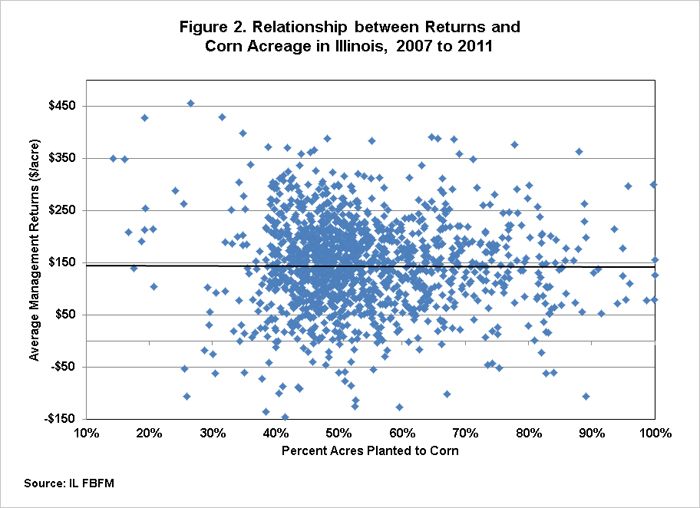
Relative prices and crop budgets have suggested that expected returns are greater for more intensive corn rotations. However, have these larger expected returns been realized on operations planting fewer soybeans? Figure 2 provides a scatterplot of the average management returns ($/acre) against the percent acres planted to corn for IL FBFM grain operations, averaged over the 5-year period from 2007 to 2011. Each data point in the plot represents the 5-year average return (on the vertical axis) plotted against the average percentage of acres planted to corn (on the horizontal axis) over the same time period on a specific grain operation in IL. Very high and very low returns are earned both at low and high levels of corn acreage, and the scatterplot does not indicate that increased corn acreage has been associated with higher (or lower) returns. The black line in the figure is a simple linear trend line fit to the data, and supports what can be seen visually from the scatterplot. The trend line does not have a positive (or negative) slope, meaning that there is not a statistical relationship between average corn acreage and returns over this 5-year time period.
If relative prices have suggested greater profitability for corn over soybeans, why hasn’t this necessarily been realized in actual returns? A number of factors are likely responsible. Anecdotal evidence from various regions of Illinois indicates that yield drags for corn following corn have been significant in the past few crop years. Production costs for corn are also greater due to higher costs for seed, fertility, and power and machinery. Both of these factors contribute to equalizing returns across rotational choices, despite higher relative corn prices.
Disclaimer: We request all readers, electronic media and others follow our citation guidelines when re-posting articles from farmdoc daily. Guidelines are available here. The farmdoc daily website falls under University of Illinois copyright and intellectual property rights. For a detailed statement, please see the University of Illinois Copyright Information and Policies here.