


Ethanol Blending Margins, RFS2 Compliance, and the Price of Gasoline
Our post on March 27 discussed the potential implications of current high prices of D6 ethanol Renewable Identification Numbers (RINs) on the cost of compliance with the 2007 Renewable Fuels Standards (RFS2) and the price of gasoline. That post focused on the complexities of the petroleum refining and blending supply chain and how RINs prices affect various participants in that supply chain. We concluded that the buying and selling of RINs within that supply chain results in something close to a zero-sum game in terms of profitability for the industry. The result is that high RINs prices at the present time likely have a minimal impact on RFS2 compliance and the cost of motor fuel at the retail level. The focus on RINs prices alone, however, diverts attention from the larger issue impacting the on-going cost of complying with RFS2 and the price of gasoline.
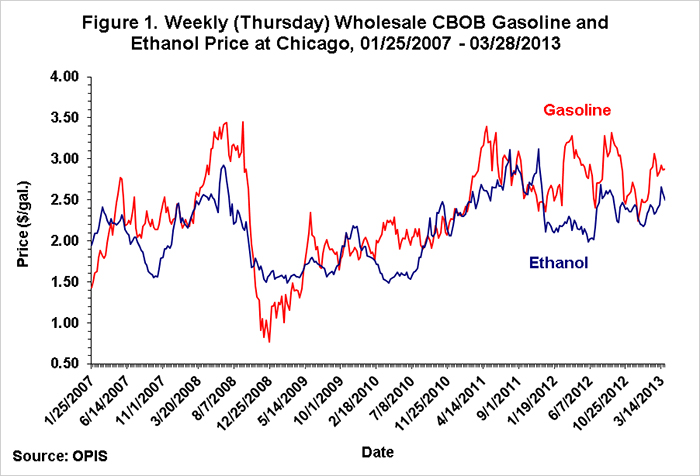
That larger issue is associated with the economics of E10 blending. That is, margins associated with blending and delivering E10 determines the gross cost of complying with RFS2 so long as the mandate is not constrained by the E10 blendwall (a point about which we will have more to say later in this post). The conventional approach to E10 blending margins is to compare ethanol and CBOB (or RBOB) gasoline prices. We focus here on CBOB prices because this is the feedstock for about two-thirds of the finished gasoline used in the U.S. Positive ethanol blending margins in this approach result from ethanol prices that are below the price of CBOB gasoline and vice versa. Positive (negative) margins result from blenders purchasing ethanol at a lower (higher) price per gallon than CBOB and selling the blend at the retail level at an equivalent price to CBOB. This type of analysis assumes that E10 does not have to be priced at a discount to reflect the lower fuel efficiency of ethanol since ethanol is such a small portion of the blend and the loss of efficiency is not easily discernible by the consumer. As indicated in Figure 1, the wholesale price of CBOB gasoline and ethanol at Chicago generally moved together for the period from January 25, 2007 through March 28, 2013, with ethanol typically priced below CBOB. The difference in those prices, however, varied considerably over that period. Those price differences are presented in Figure 2, which shows more clearly the tendency for CBOB to be priced above ethanol. The longest period of a negative price margin was from November 2008 through April 2009. The generally positive margins during this extended period are the primary reason D6 ethanol RINs prices have been quite low until recently.

Those margins can be used to approximate the magnitude of annual and total E10 blending margins over the six-year period from 2007 through 2012. Those margins are simply calculated as the average difference between CBOB and ethanol prices for the calendar year multiplied by the amount of ethanol blended into the domestic fuel supply during the year. The calculation implicitly assumes that all ethanol was consumed as an E10 blend; although very small quantities were actually consumed in E85 blends. The results of those calculations are presented in Table 1. This approach to calculating ethanol blending margins suggests that average annual blending margins were positive in five of the past six years and that blending margins totaled nearly $14.8 billion for the entire period. If one allocates the $14.8 billion to total E10 consumption in the U.S., the total margin is equivalent to just over $0.02 per gallon of E10 blended during the period. We can think of this 2 cents per gallon as a rough estimate of the gross benefit per gallon of gasoline to obligated parties under RFS2 over 2007-2012 that could have been passed on to consumers in the form of lower retail gasoline prices. The estimate of 2 cents per gallon is an estimate of the gross benefit because we have not considered other types of costs associated with RFS2 compliance, such as infrastructure, transportation, marketing, and administrative costs. These costs could have been substantial and offset much if not all of the positive blending margins. While this certainly could have been the case, the important point with regard to present policy debates about RFS2 is that there were substantial blending margins to offset these costs. In addition, there are two other issues that impact blending margin calculations.

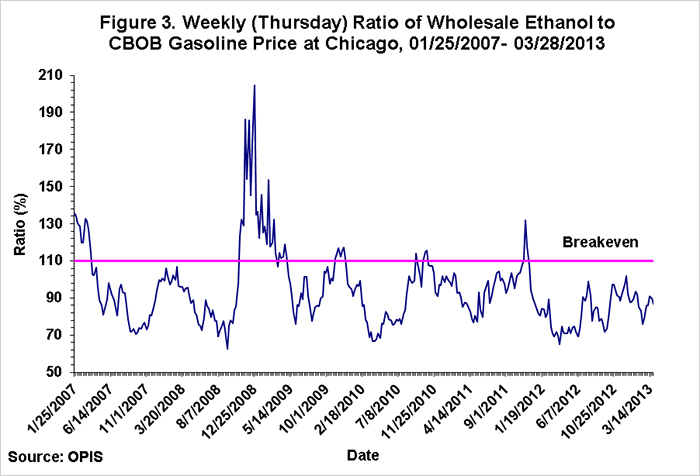
First, it could also be argued that the blending margins were even larger than estimated above due to the advantage of ethanol over other alternatives for enhancing octane in the motor fuel supply. For example, an analysis by the U.S. Department of Energy in November 2012 calculated a “break-even price of ethanol, above which it is more economic for the refiner to reduce ethanol volumes and alternatively produce more octane within the refinery.” That analysis indicates that the breakeven ethanol price is about 10 percent higher than the price of CBOB gasoline. That is, if the price of ethanol is less than 110 percent of the price of CBOB gasoline, there are positive economic returns to blending E10 for octane enhancement rather than producing more octane from other petroleum processes in the refinery. Figure 3 shows the ratio of wholesale ethanol and CBOB price at Chicago over the period January 25, 2007 through March 28, 2013. As expected based on Figure 2, the ratio was much less than 110 percent for most of the period. If blending margins were calculated as 110 percent of CBOB prices minus ethanol prices, the average blending margin during the period would be calculated at nearly $0.04 per gallon of E10, or a total of $26.9 billion.
Second, there is the issue of the magnitude of the subsidies for ethanol production and blending that were available during that period. The most important of those subsidies was the Volumetric Ethanol Excise Tax Credit (VEETC) that was available to obligated parties. That tax credit was $0.51 per gallon of ethanol blended in 2007 and 2008 and $0.45 per gallon in 2010 and 2011. The credit was not available in 2012. There is no public record of the actual claims for VEETC, but about 53 billion gallons were eligible for the credit over the six year period worth a total of $25 billion, or nearly $0.04 per gallon of E10 blended in those six years. Once again, some of the tax credit may have merely offset added infrastructure, transportation, marketing, and administrative costs associated with ethanol blending. This conclusion is at least partially supported by the large increase in the CBOB/ethanol price margin in 2012 when VEETC was not available. However, it is also plausible that the credits exceeded added costs and contributed to even larger ethanol blending margins over 2007-2011.
Implications
Through 2012, a reasonable argument can be made that the costs of compliance with RFS2 were largely or even more than offset by a combination of positive ethanol blending margins and the VEETC tax credit. Our rough estimate is that the availability of large quantities of ethanol under RFS2 may have reduced retail gasoline prices by as much as 2 cents per gallon as a result. There is considerable uncertainty about this estimate of the impact on retail gasoline prices because the degree that positive blending margins were “shared” among market participants is not known. That is, the distribution of the positive blending margins and the substantial tax credits among corn producers, ethanol producers, participants in the motor fuel supply chain, and consumers is exceedingly difficult to disentangle. In addition, taxpayers incurred costs in the form of lost tax revenues due to VEETC claims. Finally, we also did not consider potential price impacts of increasing the total supply of motor gasoline from rising quantities of ethanol, which could result in a further drop in the price of gasoline to consumers.
Looking forward, conclusions about the cost of RFS2 compliance and gasoline price impacts may change substantially. Even though ethanol blending margins are expected to remain generally positive in the future, the collision between the E10 blendwall and the RFS2 mandate in 2013 and prospects for an increasingly larger wedge between the RFS2 mandate and the E10 blendwall in 2014 and beyond raise the specter of sharply higher compliance costs. Soaring RINs prices beginning in January 2013 are an early warning sign about the potential for higher compliance costs, particularly in 2014 as the existing stock of RINs could be depleted entirely. Next week we will discuss a policy alternative for averting such a scenario.
Disclaimer: We request all readers, electronic media and others follow our citation guidelines when re-posting articles from farmdoc daily. Guidelines are available here. The farmdoc daily website falls under University of Illinois copyright and intellectual property rights. For a detailed statement, please see the University of Illinois Copyright Information and Policies here.