


Brazilian Ethanol Imports – Implications for U.S. Ethanol and Corn Demand
The current domestic ethanol market is dominated by the ongoing collision between the RFS for renewable biofuels and the E10 blend wall. Given the slow pace of market penetration of E15 and E85, the RFS likely exceeds the blend wall for ethanol in all blends in 2013. The difference between the magnitude of the RFS for renewable biofuels in 2013 (13.8 billion gallons) and the effective blend wall (estimated at 12.9 billion gallons) will be addressed with the use of blending credits accumulated from previous discretionary ethanol blending, some increase in higher blends, or possibly by discretionary blending of biomass-based biodiesel if those blending margins become positive.
Ethanol blended in the fuel supply can be produced domestically or imported from Brazil (or indirectly from Brazil through Caribbean countries). Under a blend wall constraint, imported ethanol from Brazil replaces domestically produced ethanol in the fuel supply. The magnitude of those imports, then, has important implications for the domestic ethanol industry and the demand for corn. The magnitude of U.S. ethanol imports are determined by both supply and demand considerations. The supply of Brazilian ethanol available to export to the U.S. equals Brazilian production minus domestic Brazilian consumption minus exports to other countries. Brazilian ethanol production in 2013 is expected to be larger than the 5.6 billion gallons of the past two years due to an abundant sugar cane crop and lower sugar prices. Production may be nearer the seven billion gallons of 2010. On the other hand, the ethanol blend in the Brazilian fuel supply is scheduled to increase starting next month. The U.S. imported about 490 million gallons of Brazilian ethanol in 2012. Peak imports were at 730 million gallons in 2006. On balance, the supply of Brazilian ethanol available for export to the U.S. this year is not expected to constrain imports.
An important point that we have emphasized in the past is that the demand for Brazilian ethanol is derived from the RFS that allows Brazilian ethanol to meet the advanced biofuels mandate. Without the RFS the U.S. demand for Brazilian ethanol right now would likely be close to zero because the delivered price of Brazilian ethanol to the U.S. exceeds that of domestically produced ethanol. The advanced RFS mandate has been proposed by EPA at 2.75 billion gallons for 2013. The minimum mandate for biomass-based biodiesel has been set at 1.28 billion gallons, which is equal to 1.92 billion gallons in ethanol equivalents. That leaves a balance of 830 million gallons of undifferentiated advanced biofuels required to meet the RFS. That mandate could be met with a combination of blending credits (D4 biodiesel and/or D5 undifferentiated), additional biomass-based biodiesel, other undifferentiated advanced biofuels (e.g., renewable biodiesel, sorghum ethanol) and Brazilian ethanol.
The proportion of the undifferentiated advanced biofuels requirement met by Brazilian ethanol and domestic biomass-based biodiesel will reflect the relative blending margins of the two fuels. We visited that issue in a post on January 16 and calculated the blending margin for Brazilian ethanol as the difference between the price of CBOB gasoline and the cost of Brazilian ethanol, both at the U.S. Gulf, on January 10, 2013. We also calculated an additional cost of Brazilian ethanol as the opportunity cost of the blending profit forgone by replacing domestic ethanol with Brazilian ethanol. That opportunity cost was calculated as the price of CBOB minus the price of domestic ethanol. The blending margin for biodiesel was calculated as the price of ultralow sulfur diesel minus the price of B100, both at the U.S. Gulf, plus the $1.00 per gallon blending tax credit. That difference was divided by 1.5 to reflect the blending margin in terms of ethanol equivalents. The calculated blending margins were negative for both products, but favored biodiesel over Brazilian ethanol, leading to the expectation that Brazilian ethanol imports would likely be small in 2013.
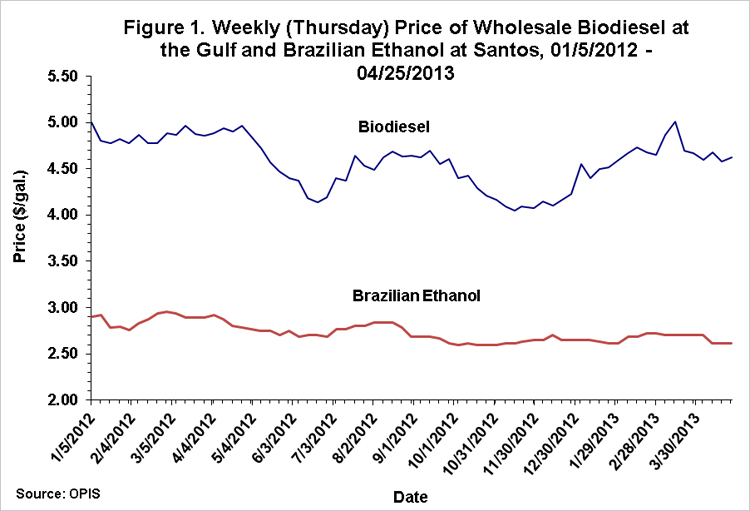
Price relationships and, as a result, relative blending margins have shifted since the beginning of the year. In particular, Figure 1 shows that biodiesel prices since early January have moved up about 40 cents per gallon. We updated our calculations of blending margins in Figure 2. For additional perspective we also extended the margins back to the beginning of 2012 (biodiesel blending margins during 2012 do not include the $1 tax credit even though it was reinstated retroactively). Note that calculated blending margins for Brazilian ethanol are shown with and without the opportunity cost calculation described earlier. Several observations are relevant. First, with a few rare exceptions, blending margins for both products have been negative. This means that neither product would have been blended in the U.S. if demand was solely driven by market price relationships. Second, even the reinstatement of the $1 blending credit for biodiesel starting in January 2013, while causing a notable improvement in blending margins, was not sufficient to drive biodiesel blending margins into positive territory. Third, since the initial upward blip in biodiesel margins in January margins for Brazilian ethanol have become relatively more favorable. This recent (March) flipping of relative blending margins is due to increasing biodiesel prices and the increase in U.S. ethanol prices relative to Brazilian ethanol prices. This latter change in pricing relationships has lowered the opportunity cost of blending Brazilian ethanol almost to zero in recent weeks, as shown by the convergence of the two lines for Brazilian ethanol. The implication is that Brazilian ethanol imports in 2013 will likely be larger than our earlier expectations if current blending margin relationships persist.

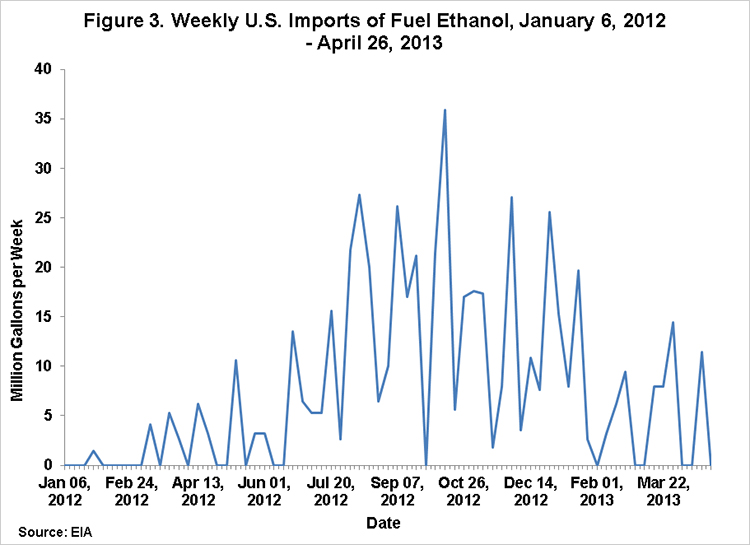
The next interesting question is whether the influence of the changing blending relationships can be detected in recent trends for Brazilian ethanol imports. The U.S. Energy Information Administration (EIA) reports U.S. ethanol imports on a weekly basis (Figure 3). Weekly imports are both highly variable and seasonal. Largest imports tend to occur after the peak of Brazilian sugar cane harvest and ethanol production in the last half of the calendar year. While still very early in the year, imports this year have been larger than those of a year ago. Through April 26, imports have totaled 100 million gallons, compared to only 23 million gallons in the same period last year when imports were partially constrained due to smaller Brazilian production. There appears to indeed have been an upward jump in the average level of imports since early February, consistent with the changing blending economics.
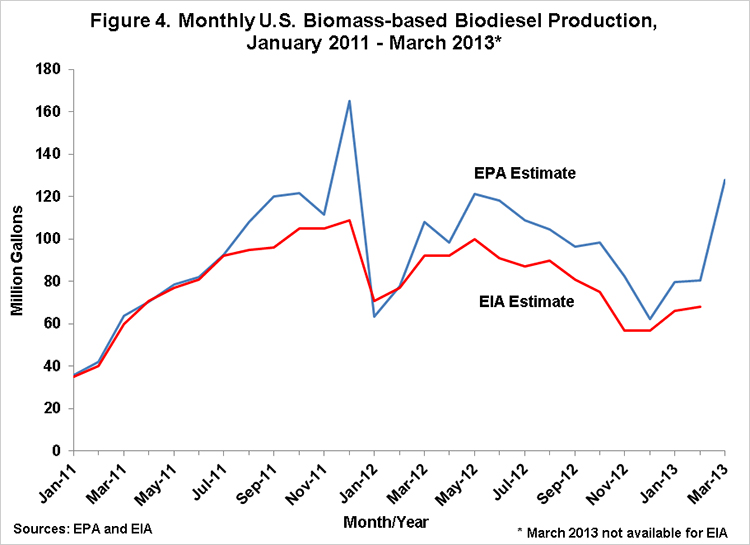
In a post on April 10 we projected imports during 2013 at only 200 million gallons. It now appears that imports could be much larger and could exceed those of last year. With the wide swings in relative blending margins, an import forecast cannot be made with much confidence. Expectations near 600 million gallons appear to be common among market analysts. Blending margins and weekly EIA import estimates will have to be monitored closely for clues as to the ultimate magnitude of Brazilian ethanol imports this year. In addition, the monthly estimates of biomass-based biodiesel production will provide clues as to whether production will exceed the minimum of 1.28 billion gallons and reduce the need for Brazilian ethanol imports. One of the difficulties with that analysis, however, is the substantial difference between production estimates for the EIA and from the EPA, as illustrated in Figure 4. Since August 2011 monthly biodiesel production estimates from the EPA have averaged about 16.5 million gallons more than EIA estimates. It is not obvious why this difference has emerged.
If we assume that U.S. ethanol exports this year are near the 500 million gallons we forecast earlier and that domestic ethanol consumption in 2013 is near 12.9 billion gallons, imports of 600 million gallons of Brazilian ethanol would imply domestic ethanol production of only 12.8 billion gallons. That is 400 million gallons less than our earlier projection and would require only 4.655 billion bushels of U.S. corn rather than 4.8 billion as projected earlier. Of course, all of these projections could change if relative blending margins swing back in favor of biodiesel.
Implications
Brazilian ethanol imports in 2013 of 600 million gallons are 400 million gallons larger than our earlier forecast and imply:
- 400 million fewer gallons of domestic ethanol production,
- 145 million fewer bushels of corn consumption, and
- A faster drawdown in ethanol blending credits.
This analysis also underscores the importance of the rate of growth in consumption of E85. A more rapid growth rate would expand the ethanol blend wall allowing larger domestic ethanol production and larger corn consumption. We will examine the conditions necessary for E85 expansion in a future post.
Disclaimer: We request all readers, electronic media and others follow our citation guidelines when re-posting articles from farmdoc daily. Guidelines are available here. The farmdoc daily website falls under University of Illinois copyright and intellectual property rights. For a detailed statement, please see the University of Illinois Copyright Information and Policies here.