


Comparing Current and 1970 Farm Prosperity: Cash Farm Expenses
Overview
This post is the 4th in a series that contrasts and compares the farm prosperity of the 1970s with the current period of farm prosperity. This post examines U.S. farm expenses during the two periods. The previous 3 posts are available here, here, and here.
Analysis
This article uses 3 variables: (1) U.S. cash farm production expenses by input category for the calendar year – includes farm origin and manufactured inputs, as well as interest, labor, property taxes, and land rent; (2) U.S. Gross Domestic Product (GDP) price deflator, and (3) acres of principal U.S. crops -includes almost all U.S. crop acres except acres in fruits, vegetables, and tree nuts.. Economists commonly use the GDP price deflator as a broad measure of price inflation in a nation’s economy. The GDP deflator is obtained from the Federal Reserve Bank of St. Louis. Rest of the data are from the U.S. Department of Agriculture (USDA), Economic Research Service and USDA, National Agricultural Statistics Service.
To facilitate comparison of the two periods, some of the measures are indexed, also called benchmarked, to a 5-year period that immediately predates the start of the period of prosperity. The benchmark periods are 1968-1972 for the 1970 period of farm prosperity and 2001-2005 for the current period of farm prosperity. Five year benchmark periods are used to dampen the variability that can exist if a single year is used as a benchmark.
The latest calendar year for which information on farm expenses by input type is available is 2011, the 6th year after 2005. The comparable year for the 1970 period is 1978, the 6th year after 1972. There is no definitive way to decide when to start the period of prosperity or what period to use as a benchmark, but these choices are reasonable. As more data become available for the current period, the analysis period can be extended, but 6 years is long enough for an initial comparison.
Cash Farm Production Expenses
The previous post in this series (available here) found that farm debt, especially non-real estate debt, had increased more during the 1970 period of prosperity than during the current period of farm prosperity. Furthermore, interest rates increased during the 1970s in response to increasing inflation. In contrast, interest rates have declined during the current period of farm prosperity. These observations imply that interest expense should have increased more during the 1970 period of prosperity.
As Figure 1 illustrates, deflated interest expense was 87% higher in 1978 than during the 1968-1972 benchmark period. In, contrast, deflated interest expense was 7% lower in 2011 than during the 2001-2005 benchmark period. These different paths for interest expense is one reason that deflated net cash farm income declined during the 1970 period of farm prosperity after an initial spike higher but has increased steadily during the current period of farm prosperity.
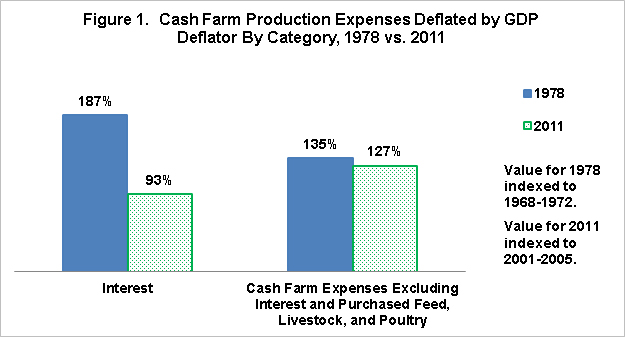
Figure 1 also presents cash farm expenses excluding interest as well as feed, livestock, and poultry purchased by farms. The latter three expense categories are removed because I would like to focus this post on crop production expenses. While some of the other input categories used by USDA include expenses for livestock and poultry production, these expenses are entirely related to livestock and poultry production. The resulting category of generally crop-related expenses also had increased more by 1978 than by 2011, although the difference was much smaller than for interest: 35% between 1968-1972 and 1978 vs. 27% between 2001-2005 and 2011. This comparison thus suggests that deflated cash crop production expenses have increased by less during the current period of farm prosperity than during the 1970 period of farm prosperity.
Principal Crop Acres
A key difference between the two periods of farm prosperity is the different path of principal crop acres. Despite the profitability of crop production, only 6 million, or 2%, more acres were planted to principal crops in 2012 than in 2005 (see Figure 2). In contrast, between 1972 and 1979 acres planted to principal crops increased by 51 million or 17%. Principal crop acres increased by another 18 million between 1979 and 1981, which is the peak year for principal crop acres over the last half century (363 million principal crop acres).
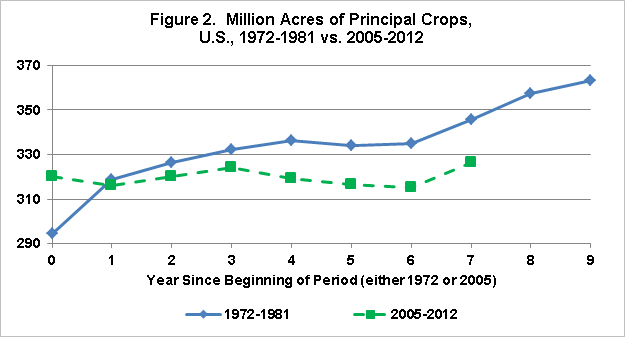
The different paths in principal crop acres likely reflect a number of contributing factors. One is that land in set aside programs in 1972 could readily return to production. Between 1972 and 1973, principal crop acres increased by 24 million. However, the U.S. eliminated annual land set aside programs in the 1996 Farm Bill, causing principal crop acres to increase by 15.5 million between 1995 and 1996. Thus, no reserve of annual set-aside land existed when the current period of farm prosperity began. In fact, principal crop acres during the current period of prosperity have still not exceeded the 334 million acres planted to principal crops in 1996.
Another factor is the role of conservation programs. Of particular relevance are the Conservation Reserve Program (CRP), which pays farms to produce environmental services as opposed to crops, and the sodbuster and swampbuster provisions, which prevent farms from bringing these types of land into crop production. These 3 conservation programs were first enacted in the 1985 Farm Bill. Approximately 25 million acres are currently enrolled in CRP. In addition, approximately 2 million acres are enrolled in the Wetlands Reserve Program.
Two additional points are worth making. First, the expansion in corn acres since 2005 (15 million) has mostly come from acres planted to other crops. This realignment of acres may be causing unease among agribusiness firms and farms tied to other crops regarding their future in a world of increasing corn acres.
Second, the impact on production expenses by the differential change in acres between the two periods of farm prosperity can be assessed in a simple manner. Deflated cash farm expenses excluding interest as well as purchased feed, livestock, and poultry can be divided by the number of acres planted to principal crops. Between 1972 and 1978 this per acre measure of deflated cash farm expenses increased by 20%. Between 2005 and 2011 the increase was 30%. This comparison implies that, once the different path of acres is taken into account, it is likely that crop expenses per acre have increased more during the current period of farm prosperity than during the 1970 period of farm prosperity.
Comparison of Expenses by Input
Figure 3 presents the change in deflated expenses for purchased seed, fertilizer and lime, pesticides, fuel and oil, property taxes, and net rent. Property taxes, fertilizer and lime, and net rent had all increased more during the current period of farm prosperity. The rate of increase during the two periods of prosperity was relatively similar for purchased seed and fuel and oil. On the other hand, spending on pesticides increased more during the 1970s. Moreover, during the current period of prosperity, spending on pesticides have had a smaller percentage increase than any of the other expense categories listed in Figure 3. Thus, pesticide expenses have dampened the overall increase in total cost of crop production. Last, despite all of the talk about increasing land rents during the current period of farm prosperity, they have increased by a smaller percent than any of the other inputs included in Figure 3, except for pesticides.

Summary Observations
The different time paths of interest expense and land planted to principal crops are major differences between the current and 1970 periods of farm prosperity. The muted increase in interest expense during the current period of prosperity has positively impacted net farm income and allowed farms to avoid debt. However, the muted increase in interest expense also means that any downturn in crop revenue will result in a cost-price squeeze between crop prices and the prices of crop production inputs. A key question could become how much flexibility do crop farms have when buying crop inputs. The sharp decline in crop prices in 2009 led farms to delay input purchases. This event could foreshadow a far more intense confrontation if, probably when not if, a longer lasting decline in crop prices occur. In short, crop input suppliers may bear far more of this adjustment process than they did during the 1980s, when declining debt and interest expenses bore more of the adjustment.
The lack of expansion in planted acres in the U.S. implies that the often-referenced food vs. fuel debate is an inaccurate characterization of the situation confronting U.S. agriculture in the 21st Century. U.S. crop agriculture has become not only a provider of food and fuel but also a provider of environmental services, such as reduced water and wind erosion and improved wildlife habitats. In other words, 21st Century Agriculture is not just characterized by an expansion into the fuel market but also by an expansion into the environmental services market. Hence, it is not a food vs. fuel dilemma but a food vs. fuel vs. environmental services dilemma. It is not unreasonable to conjecture that crop prices would be notably lower and livestock profits notably higher if all the land in CRP was in production. This observation is not a criticism of farm environmental programs. Instead, it is pointing out a fundamental difference between the current and 1970 periods of farm prosperity — the willingness of contemporary American society to continue to support farm-based environmental services in a period of high farm commodity prices. To put this observation somewhat differently, are the events of the last 7 years asking us to ponder this question, Is U.S. society as whole choosing farm environmental services over profitability of the U.S. livestock sector?
The next post in this series will further examine the expansion in production during the 1970 and current periods of farm prosperity.
This publication is also available at http://aede.osu.edu/publications
Disclaimer: We request all readers, electronic media and others follow our citation guidelines when re-posting articles from farmdoc daily. Guidelines are available here. The farmdoc daily website falls under University of Illinois copyright and intellectual property rights. For a detailed statement, please see the University of Illinois Copyright Information and Policies here.